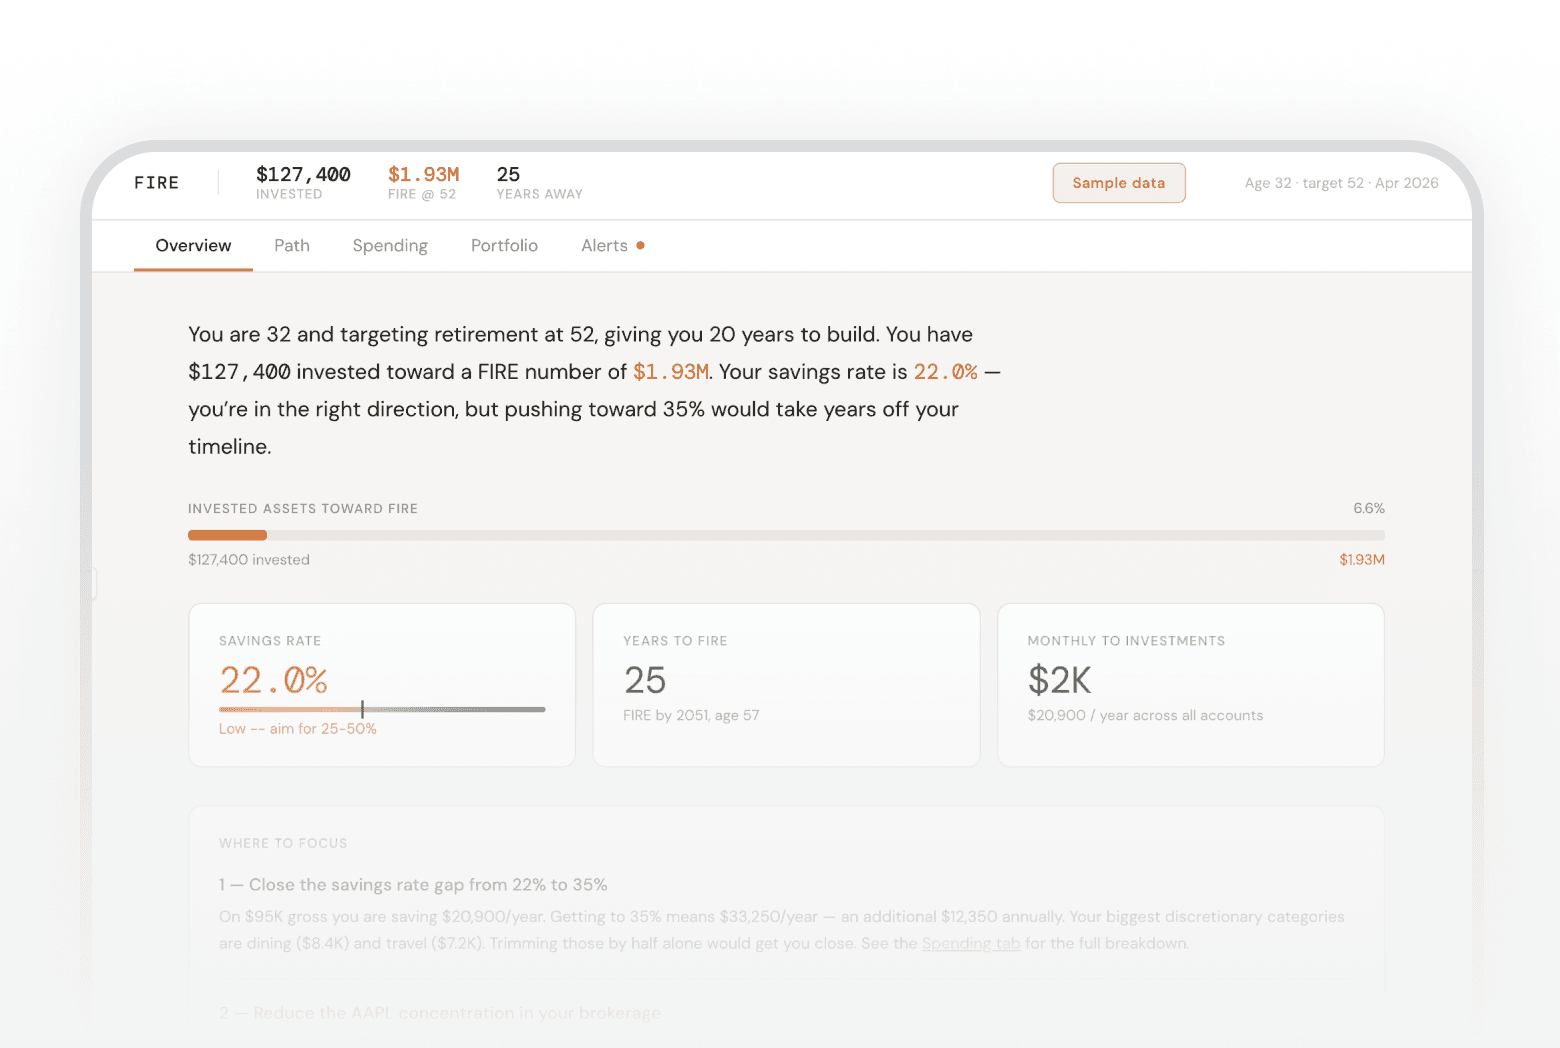

This prompt fetches your balances, spending history, contributions, performance, and holdings from Truthifi, asks for your current age and target retirement age, then builds a five-tab FIRE dashboard with compound-growth projections, scenario sliders, savings rate analysis, and portfolio diagnostics.
how to calculate when I can retire early
FIRE number calculator with real account data / how to know if I'm on track for financial independence
About this prompt
FIRE planning comes down to three numbers: how much you have, how much you spend, and what your money earns. This prompt pulls all three from your live accounts and builds an interactive five-tab dashboard that tells you whether you're on track.
Prompt details
--- > **How to use this prompt:** Copy everything below this line into a new Claude chat that has the Truthifi MCP connected, then follow the instructions — by doing so you agree to the [Truthifi Prompt Gallery Terms of Use](https://truthifi-connect.ai/prompt-gallery-terms). --- ``` ━━━━━━━━━━━━━━━━━━━━━━━━━━━━━━━━━━━━━━━━━━━━━━━━━━━━━━━━━━━━━━━━━━━━ ⚠️ TRUTHIFI PROMPT GALLERY — USE RESPONSIBLY ━━━━━━━━━━━━━━━━━━━━━━━━━━━━━━━━━━━━━━━━━━━━━━━━━━━━━━━━━━━━━━━━━━━━ This prompt is published in the Truthifi Prompt Gallery and is intended for users who understand how AI prompts work and who take personal responsibility for their use and any outputs produced. • NOT FINANCIAL ADVICE — all AI-generated output is for informational and entertainment purposes only. Nothing produced by this prompt constitutes investment, tax, legal, or financial advice of any kind. • YOUR DATA — portfolio data is retrieved live from your Truthifi account via MCP solely within your active AI session. It is not stored, logged, or transmitted by this prompt beyond what is described in Truthifi's Privacy Policy. • SHARING — outputs may contain real portfolio data rendered as formatted values. Review any generated file carefully before sharing it publicly or with third parties. • MODIFICATIONS — altering this prompt, removing safety language, or repurposing it outside its stated purpose removes Truthifi's intended safeguards. Any such use is entirely at your own risk. • LIABILITY — Truthifi accepts no liability for AI-generated outputs, their accuracy, or any decisions made based on them. By running this prompt you confirm you have read and agree to the Truthifi Prompt Gallery Terms of Use. Full terms: https://truthifi-connect.ai/prompt-gallery-terms ━━━━━━━━━━━━━━━━━━━━━━━━━━━━━━━━━━━━━━━━━━━━━━━━━━━━━━━━━━━━━━━━━━━━ ``` --- # FIRE Dashboard — Your Path to Financial Independence **Truthifi MCP Required** | Version: 2.1.0 | Created: 2026-04-01 --- ## 🎯 GOAL Build a single-page, interactive FIRE (Financial Independence, Retire Early) dashboard using live data from your Truthifi-connected accounts. The dashboard is structured as five goal-oriented tabs — Overview, Path, Spending, Portfolio, Alerts — each serving a distinct user intent, so a person optimizing their savings rate never has to scroll past equity sector data to find what they need. The design is deliberately restrained: near-monochrome warm paper palette, two fonts (DM Mono for numbers, DM Sans for prose), and a single amber accent used only for the FIRE number and genuine warnings. Hierarchy comes from type weight and size — not from competing colored badges or containers. --- ## 📋 CONTEXT & BACKGROUND FIRE planning requires knowing three numbers: how much you have, how much you spend, and how much your money earns. This prompt pulls all three directly from your connected accounts and overlays them onto compound-growth projections calibrated to your actual age and retirement target. The result tells you honestly whether you are on track, what the biggest gaps are, and — critically — where to focus first. The dashboard leads every tab with the diagnostic conclusion, not the raw data. A user who opens the Portfolio tab should immediately see whether their allocation is appropriate for their FIRE timeline, not just a list of asset classes. --- ## 🔌 TRUTHIFI MCP DEPENDENCIES | Step | MCP Tool | Purpose | Key Parameters | |------|----------|---------|----------------| | 1 | `get_accounts` | Classify accounts by type | `include: ["accountId","providerName","name","type","subType"]`, `accountIds: null` | | 2 | `get_balance_history` | Total net worth and invested-assets subtotal | `dateRange: { from: "[current year]-01-01", to: "[today ISO]" }`, `include: ["accountId","initialBalance","endingBalance"]`, `accountIds: null` | | 3 | `get_budget_flows` | Spending by category AND descriptions for re-categorisation | `dateRange: { from: 12 months ago, to: today }`, `include: ["accountId","date","description","amount","transactionCategory"]`, `limit: 500`, `accountIds: [<primary credit card accountId>]` | | 4 | `get_investment_transactions` | Identify new-money contributions and paycheck deposits | `dateRange: { from: 12 months ago, to: today }`, `transactionTypes: ["cash_deposit","contribution","dividend_reinvestment"]`, `include: ["amount","date","accountId","description","transactionType"]`, `limit: 100`, `accountIds: null` | | 5 | `get_performance_history` | 2-year aggregate return, P&L, income, benchmark alpha | `dateRange: { from: 2 years ago, to: today }`, `aggregate: true`, `include: ["totalReturn","totalPnL","totalIncome","similarBenchmark"]`, `accountIds: null` | | 6 | `get_composition` | Asset class and sector breakdown | `arrangeBy: ["TraditionalAssetClasses","Sectors"]`, `dateRange: { from: first of current month, to: today }`, `include: ["classificationType","holdings"]`, `accountIds: null` | | 7 | `get_equity_concentrations` | Top 8 equity positions by value, including indirect holdings | `date: [today ISO]`, `include: ["symbol","securityName","balance","weight","numOfHoldings"]`, `sort: { field:"balance", direction:"desc" }`, `limit: 8`, `accountIds: null` | | 8 | `get_findings` | Portfolio flags and alerts | `include: ["findingName","description","findingDetails"]`, `limit: 6`, `accountIds: null` | > ⚠️ Requires active Truthifi MCP connection. `accountIds: null` is explicitly set on all calls except Call 3, which is scoped to the primary credit card account identified from Call 1. --- ## 🙋 USER-CAPTURED DATA REGISTRY | # | Placeholder | What to Provide | Example | Default if skipped | Required? | |---|-------------|-----------------|---------|-------------------|-----------| | 1 | `{{UCD:CURRENT_AGE}}` | Your current age in whole years | `32` | `30` | Yes | | 2 | `{{UCD:TARGET_RETIREMENT_AGE}}` | The age at which you want to stop working | `50` | `55` | Yes | **Privacy note:** These two values are used only to compute years-to-retirement, FIRE number projections, and milestone ages. They exist only in this conversation and are not stored, logged, or transmitted anywhere. --- ## 🎨 DESIGN SYSTEM The design is near-monochrome. Restraint is intentional. Every colour decision must be justified by meaning, not decoration. **Font pairing rationale:** DM Mono is chosen for all financial data because its tabular figures and consistent glyph width prevent number columns from shifting as values change. At large sizes (28–40px) it also carries sufficient visual weight to function as a display typeface, removing the need for a separate headline font and keeping the palette calm. DM Sans is chosen for prose and labels because it shares DM Mono's geometric clarity without competing with it — both fonts were designed as a family and feel tonally identical at mixed sizes. ### Palette All colours are declared as CSS custom properties on `:root`. No raw hex values appear outside the `:root` block. **Page & Surfaces** | Role | CSS Variable | Hex | |------|-------------|-----| | Page background | `--page` | `#f7f5f2` | | Card surface | `--s0` | `#ffffff` | | Secondary surface | `--s1` | `#faf8f5` | | Tertiary / inset | `--s2` | `#f2efe9` | | Deepest surface | `--s3` | `#e8e4dd` | **Borders** | Role | CSS Variable | Hex | |------|-------------|-----| | Default border | `--b0` | `#e4e0d9` | | Hover / emphasis | `--b1` | `#d4cfc6` | | Strong border | `--b2` | `#c0bab0` | **Type** | Role | CSS Variable | Hex | |------|-------------|-----| | Primary (headlines) | `--ink0` | `#1a1814` | | Secondary (body, labels) | `--ink1` | `#4a4740` | | Tertiary (meta, captions) | `--ink2` | `#8a857c` | | Disabled / placeholder | `--ink3` | `#b8b3a8` | **Single accent — Amber** Used ONLY for: the FIRE number, active tab underline, warning states, and the "where to focus" section. Not for decoration. | Role | CSS Variable | Hex | |------|-------------|-----| | Dark amber — strong signal | `--amber` | `#c45c1a` | | Mid amber — progress fills | `--amber2` | `#e07830` | | Light amber — softer states | `--amber3` | `#f2a060` | | Amber tint — alert backgrounds | `--amber4` | `#fdf0e6` | | Amber borders | `--amberborder` | `#f0c8a0` | **Positive signal — Sage green** Used ONLY for: achieved milestones, positive metrics (good return, adequate runway), "on track" states. | Role | CSS Variable | Hex | |------|-------------|-----| | Dark sage | `--sage` | `#2d6e4e` | | Mid sage | `--sage2` | `#4a9a72` | | Sage tint | `--sage4` | `#edf5f0` | | Sage border | `--sageborder` | `#b8dcc9` | **Risk signal — Muted rose** Used ONLY for: delisting risk, critically low savings rate, the Alerts tab dot. | Role | CSS Variable | Hex | |------|-------------|-----| | Dark rose | `--rose` | `#9e3535` | | Mid rose | `--rose2` | `#c04040` | | Rose tint | `--rose4` | `#fdf0f0` | | Rose border | `--roseborder` | `#f0c0c0` | **Chart Series** | Role | Hex (hardcoded in JS — Chart.js canvas does not resolve CSS variables) | |------|--------| | Base line stroke | `#e07830` (mirrors `--amber2`) | | Base line fill | `rgba(224,120,48,.06)` | | Pessimistic line | `#c0bab0` (mirrors `--b2`) | | Boost line | `#4a9a72` (mirrors `--sage2`) | | FIRE target line | `#c0bab0` (mirrors `--b2`) | | Barista FIRE line | `#d4cfc6` (mirrors `--b1`) | | Tooltip background | `#ffffff` | | Tooltip border | `#e4e0d9` (mirrors `--b0`) | | Tick / grid label | `#b8b3a8` (mirrors `--ink3`) | | Grid lines | `rgba(0,0,0,.04)` | **Conditional Logic** | State | Background | Border / Color | |-------|-----------|---------------| | Milestone achieved | `--sage4` (`#edf5f0`) | `--sageborder` (`#b8dcc9`) | | Warning alert card | `--amber4` (`#fdf0e6`) | `--amberborder` (`#f0c8a0`) | | Risk alert card | `--rose4` (`#fdf0f0`) | `--roseborder` (`#f0c0c0`) | | Info alert card | `--s2` (`#f2efe9`) | `--b1` (`#d4cfc6`) | | Savings rate — critical (<10%) | `--rose2` | `--rose2` | | Savings rate — low (10–24%) | `--amber` | `--amber` | | Savings rate — getting there (25–39%) | `--amber2` | `--amber2` | | Savings rate — strong (≥40%) | `--sage` | `--sage` | ### Typography Two fonts only. No exceptions. | Role | Font | Source | Weights | Used for | |------|------|--------|---------|---------| | Numbers / monospace | DM Mono | Google Fonts | 300, 400, 500 | All financial values, years, percentages, the logo | | Body / UI | DM Sans | Google Fonts | 300, 400, 500 | All prose, labels, tab names, captions | **Font load tag:** ```html <link href="https://fonts.googleapis.com/css2?family=DM+Mono:ital,wght@0,300;0,400;0,500&family=DM+Sans:wght@300;400;500&display=swap" rel="stylesheet"> ``` **Type scale:** | Class | Semantic level | Size | Weight | Font | Letter-spacing | Used for | |-------|---------------|------|--------|------|---------------|---------| | `.num-xl` | h1 equivalent | 40px | 300 | DM Mono | -0.03em | Hero numbers (available, not currently placed) | | `.num-lg` | h2 equivalent | 28px | 400 | DM Mono | -0.025em | Key metrics (savings rate, years to FIRE) | | `.num-md` | h3 equivalent | 20px | 400 | DM Mono | -0.02em | Secondary metrics, scenario fan values | | `.num-sm` | h4 equivalent | 15px | 400 | DM Mono | -0.01em | Inline numbers in prose, header stats | | `.num-xs` | caption-level | 12px | 400 | DM Mono | 0 | Table numbers, small data | | `.label` | UI label | 10px | 500 | DM Sans | +0.08em | All section labels (uppercase) | | `.body-sm` | body | 12px | 400 | DM Sans | 0 | Card body text | | `.caption` | caption | 11px | 400 | DM Sans | 0 | Metadata, sub-labels | Minimum font size: 11px. No element renders below this. ### Spacing & Layout | Property | Value | |----------|-------| | Content max-width | 960px, centered | | Panel padding | 32px 32px 80px | | Card padding | 20px 22px | | Card border-radius | 10px (`--radius`) | | Inset border-radius | 6px (`--radius-sm`) | | Header height | 56px | | Tab nav padding | 0 32px | | Standard grid gap | 12px | | Section gap | 16–32px | ### Component Specifications **Sticky shell** — header + tab nav are wrapped in a single `position: sticky; top: 0` container with `background: var(--s0)` and `border-bottom: 1px solid var(--b0)`. The header and tab nav are separated by an inner border. **Header** — one line, three numbers maximum: Invested, FIRE @ target age, Years away. The logo is `FIRE` in DM Mono. Right-aligned meta shows age + target + date. No badges, no icons. ```css .header { display: flex; align-items: center; padding: 0 32px; height: 56px; gap: 32px; border-bottom: 1px solid var(--b0); } .header-stat-val { font-family: var(--font-num); font-size: 15px; font-weight: 500; letter-spacing: -0.01em; line-height: 1; } .header-stat-label { font-size: 10px; color: var(--ink3); letter-spacing: 0.04em; text-transform: uppercase; line-height: 1; } ``` **Tab nav** — five tabs, bottom-border active state in `--amber`. No backgrounds, no filled states. Inactive tabs are `--ink2`, active tab is `--ink0` weight 500. The Alerts tab has a 6px `--rose2` dot when findings exist. ```css .tab-btn { background: none; border: none; border-bottom: 2px solid transparent; padding: 10px 16px 9px; font-size: 13px; font-weight: 400; color: var(--ink2); cursor: pointer; } .tab-btn.active { color: var(--ink0); border-bottom-color: var(--amber); font-weight: 500; } ``` **Cards** — white background, `--b0` border, 10px radius, 20px 22px padding. **Inset blocks** — `--s2` background, `--b0` border, 6px radius, 12px 14px padding. Used for secondary info within a card (e.g. tax account breakdown). **Alert cards** — three variants: - `.alert-card.warn` — `--amber4` background, `--amberborder` border (performance issues, allocation warnings) - `.alert-card.risk` — `--rose4` background, `--roseborder` border (delisting, critical risk) - `.alert-card.info` — `--s2` background, `--b1` border (connection quality, neutral info) **Progress bars:** ```css .bar-track { background: var(--s3); border-radius: 3px; overflow: hidden; } .bar-fill { border-radius: 3px; transition: width 0.3s ease; background: var(--amber2); } .bar-fill.sage { background: var(--sage2); } .bar-fill.ink { background: var(--b2); } .bar-fill.rose { background: var(--rose2); } ``` Heights: `.h4` = 4px, `.h6` = 6px, `.h8` = 8px, `.h10` = 10px. **Range sliders:** ```css input[type=range] { -webkit-appearance: none; width: 100%; height: 2px; background: var(--b1); border-radius: 1px; outline: none; cursor: pointer; } input[type=range]::-webkit-slider-thumb { -webkit-appearance: none; width: 14px; height: 14px; border-radius: 50%; background: var(--ink0); border: 2px solid var(--s0); box-shadow: 0 1px 4px rgba(0,0,0,.18); } ``` **Savings rate spectrum** — a 4px gradient bar (rose → amber → sage), with a 2px ink-coloured vertical pin that moves via JavaScript. No fill, just a pin on a gradient. ```css .sr-spectrum { height: 4px; border-radius: 2px; background: linear-gradient(90deg, var(--rose2) 0%, var(--amber3) 30%, var(--sage2) 65%, var(--sage) 100%); position: relative; } .sr-pin { position: absolute; top: -5px; width: 2px; height: 14px; background: var(--ink0); border-radius: 1px; transform: translateX(-50%); transition: left 0.3s; } ``` **Milestone cards** — white card, `--b0` border, cursor pointer. On `.achieved`: `--sageborder` border, `--sage4` background. No colour changes on non-achieved hover — only border goes to `--b1`. Click/Enter/Space expands a `.ms-desc` description block. A small `.ms-tag` element (10px, DM Sans, bordered) replaces coloured pill badges. **Scenario fan cards** — `.fan-card` uses `--s1` background, `--b0` border. The base/active card uses `--s0` background, `--b1` border. **Stacked bar (spending split):** ```css .bar-stack { display: flex; border-radius: 4px; overflow: hidden; } .bar-stack-seg { height: 8px; } ``` Fixed segment: `--sage2`. Discretionary segment: `--amber2`. **Account rows** — no badges. Each account has a 6px coloured dot: amber2 for retirement, sage2 for banking, b2 for investing, rose2 for credit. Name + sub-label stacked. Balance right-aligned in DM Mono. **Equity concentration rows** — ticker in DM Mono, security name in DM Sans, proportional bar (`.bar-fill.ink` or `.bar-fill.rose` for flagged), weight percentage and balance right-aligned in DM Mono. If `weight` is null, display `—%`. If account lookup by accountId returns `undefined`, skip the row silently — never render raw IDs or "Unknown" labels. ### External References Load in this exact order: ```html <link rel="preconnect" href="https://fonts.googleapis.com"> <link href="https://fonts.googleapis.com/css2?family=DM+Mono:ital,wght@0,300;0,400;0,500&family=DM+Sans:wght@300;400;500&display=swap" rel="stylesheet"> <script src="https://cdnjs.cloudflare.com/ajax/libs/Chart.js/4.4.1/chart.umd.js"></script> ``` All CDN URLs are pinned to exact versions. No unpinned dependencies. --- ## 🖼️ VISUALIZATION SPEC ### Chart.js Portfolio Projection — Line Chart | Property | Value | |----------|-------| | Library | Chart.js 4.4.1 via cdnjs | | Type | `line` | | Duration | 25 years (`YRCNT`) | | X-axis | Year labels: `BASE_YEAR` through `BASE_YEAR + YRCNT` | | Y-axis | Portfolio value in dollars, formatted via `fm()` | | Canvas height | 220px fixed (`maintainAspectRatio: false`) | | Responsive | `true` | | Animation duration | `160ms` | | Legend | Disabled in Chart.js (`display: false`); custom HTML legend above canvas | **Datasets:** | Dataset | Label | borderColor | backgroundColor | borderDash | borderWidth | pointRadius | fill | |---------|-------|------------|----------------|------------|-------------|-------------|------| | Base portfolio | `'Base'` | `#e07830` | `rgba(224,120,48,.06)` | none | 2 | 0 | `true` | | Pessimistic (5%) | `'Pes.'` | `#c0bab0` | — | `[4,4]` | 1.5 | 0 | `false` | | Boost (+$15K) | `'Boost'` | `#4a9a72` | — | `[4,4]` | 1.5 | 0 | `false` | | Full FIRE target | `'FIRE'` | `#c0bab0` | — | `[6,4]` | 1 | 0 | `false` | | Barista FIRE target | `'Barista'` | `#d4cfc6` | — | `[3,4]` | 1 | 0 | `false` | All datasets use `tension: 0.3`. **Axes configuration:** ```js scales: { x: { grid: { display: false }, ticks: { color: '#b8b3a8', font: { size: 10, family: 'DM Mono, monospace' }, maxTicksLimit: 9 } }, y: { grid: { color: 'rgba(0,0,0,.04)' }, border: { display: false }, ticks: { color: '#b8b3a8', font: { size: 10, family: 'DM Mono, monospace' }, callback: v => fm(v) } } } ``` **Tooltip configuration:** ```js tooltip: { backgroundColor: '#ffffff', borderColor: '#e4e0d9', borderWidth: 1, titleColor: '#8a857c', bodyColor: '#1a1814', callbacks: { label: c => c.dataset.label + ': ' + fm(c.raw) } } ``` **Note:** Chart.js canvas rendering does not resolve CSS custom properties. The hex values in this section are intentional hardcodes that mirror the Design System palette exactly. Do NOT replace them with `var()` references. **Destroy before re-render:** `if (chart) chart.destroy();` must be called before every new `new Chart(...)` call to prevent canvas reuse errors. --- ## ⚙️ CONFIGURATION OPTIONS | Parameter | Default | Source | User-adjustable | Slider range | Notes | |-----------|---------|--------|----------------|-------------|-------| | Annual spending | Derived from `get_budget_flows` | MCP | Yes — slider | $10K–$200K | Synced between Path and Spending tabs | | Annual savings | Derived from `get_investment_transactions` | MCP | Yes — slider | $1K–$100K | Path tab only | | Return rate | 7.0% nominal | Fixed default | Yes — slider | 3%–12% | Pessimistic scenario always uses 5% regardless | | Safe withdrawal rate | 4.0% (`SWR`) | Fixed | No — locked | — | Distinct from return rate; locked to enforce safe-withdrawal discipline | | Spending inflation | 2.0% (`INFL`) | Fixed | No — locked | — | Baked into FIRE number formula; not exposed as a control | | Projection window | 25 years (`YRCNT`) | Fixed | No — locked | — | Edit `YRCNT` in script constants to change | | Boost scenario delta | $15,000/yr (`BOOST`) | Fixed | No — locked | — | Edit `BOOST` in script constants to change | | Pessimistic return | 5.0% (`PES_RATE`) | Fixed | No — locked | — | Always used for the pessimistic scenario fan card | --- ## 📐 DASHBOARD LAYOUT ### Structure A single HTML file. Structure in this order: ``` 1. <!DOCTYPE html> / <html lang="en"> 2. <head>: charset, viewport, title, font links 3. <style>: complete CSS — :root, then all component styles 4. <body>: a. .shell (sticky) → .header + nav.tab-nav b. Five .panel divs (id="p-0" through "p-4") c. <footer> AI disclaimer 5. Chart.js <script src> 6. <script>: UCD constants → MCP-derived variables → fixed assumptions → helper functions → update() → slider bindings → tab/milestone handlers → init() ``` ### Tab Architecture Five tabs, each with a single clear job: | Tab | ID | Job | Primary user question | |-----|----|-----|----------------------| | Overview | `p-0` | Orientation + top priorities | Where do I stand? | | Path | `p-1` | Projections + milestones | When do I get there? What moves the date? | | Spending | `p-2` | Spending breakdown + savings rate | Where does my money go? What's cuttable? | | Portfolio | `p-3` | Allocation, tax composition, accounts | Is my money working hard enough? | | Alerts | `p-4` | Findings only | What needs attention right now? | **Rule:** Content belongs in exactly one tab. A user on the Spending tab should never need to see equity sector allocation. A user on the Portfolio tab should not see a spending breakdown. Cross-tab links (e.g. a button in Overview that navigates to Spending) are the only permitted cross-reference. ### Tab 0 — Overview Section order: 1. **Opening statement** — one paragraph of plain prose (no card) naming the user's situation, their FIRE number, and their savings rate. No bullet points, no badges, no containers. This is the single most important paragraph in the dashboard. 2. **FIRE progress bar** — label + percentage + bar track + start/end labels. Tracks invested assets vs FIRE number. Does NOT use net worth. 3. **Three-card stat row** — savings rate (with spectrum + pin), years to FIRE, monthly savings. Each in a plain `.card`. 4. **"Where to focus" card** — a single `.card` with a `.label` header "Where to focus". Two numbered items in plain body text, no coloured containers. Each item links to the relevant tab using an inline `<button onclick="sw(n)">` styled as a text link (amber colour, underline, no background). Nothing else. No hero card. No accounts list. No allocation breakdown. ### Tab 1 — Path Section order: 1. **Controls card** — three sliders (Annual spending, Annual savings, Return rate) in a 3-column grid. Sliders are the primary interaction; they drive everything below. 2. **Scenario fan** — three cards side by side: Pessimistic (5% return, current save), Base (slider rate, current save), Boost (+$15K/yr at base rate). Each shows 25-year portfolio value and FIRE year. 3. **Chart card** — custom HTML legend above canvas, 220px height chart. Five datasets per Visualization Spec. 4. **Milestones** — 2×2 grid. Four cards: Coast to 65, Coast to 55, Barista FIRE, Full FIRE. Each expandable. ### Tab 2 — Spending Section order: 1. **Spending slider card** — spending slider + live FIRE number + Barista FIRE number. Shows the direct impact of spending on FIRE target. 2. **Fixed vs discretionary** — stacked bar + legend + one-line synthesis ("X% of your spending is discretionary"). 3. **Category breakdown card** (`card-flush`) — `.label` header + caption about data source, then a list of spend rows (name + discretionary/fixed tag + proportional bar + dollar amount). Sorted by amount descending. 4. **Savings rate context card** — left side: large savings rate number + spectrum + pin + context label. Right side: benchmark table (traditional retirement, FIRE in 15yr, FIRE in 10yr, extreme FIRE) as plain rows with DM Mono percentages. The spending slider on this tab is synced with the spending slider on the Path tab — moving either updates both. ### Tab 3 — Portfolio Section order: 1. **Asset allocation card** — lead with the diagnostic conclusion ("At age X with a Y-year runway, most FIRE frameworks target 85–100% equity. You're at Z%." in amber if misaligned). Then allocation bars. Then one caption explaining the alpha gap. 2. **Tax account composition card** — three `.inset` blocks in a 3-column grid: Tax-advantaged IRA, Cash/Banking, Taxable Brokerage. Each inset shows account type label, dollar value, institution, and one line of FIRE sequencing context. 3. **Liquidity / cash runway card** — runway in months (sage), liquid dollar amount, bar with 0/6mo/12mo/18mo markers, and deployment opportunity (excess above 6-month buffer). 4. **Performance card** — 2-yr total return, alpha, P&L/income in a 3-column grid. One-line caption explaining the alpha gap. 5. **Sector breakdown card** — top sectors with proportional bars. 6. **Top equity concentrations card** — up to 8 rows, sorted by balance descending. Each row: ticker (DM Mono), security name (DM Sans, truncated), proportional bar, weight percentage, balance. If `weight` is null, display `—%`. Deduplicate by ticker — prefer the entry with the higher balance. Includes a caption noting these include indirect holdings via ETFs/mutual funds. 7. **Accounts card** — account rows with coloured dots, name, sub-label, balance. ### Tab 4 — Alerts Section order: 1. **Section label** — plain `.label` text: "N active findings". 2. **Alert cards** — one per finding, sorted: risk (rose) first, then warn (amber), then info (grey). Each card: finding name + one-word type label + metadata caption + body text description. Body text is direct and specific — name the ticker, the account, the gap. 3. **All-clear card** (if zero findings) — plain `.card`, centred text, ✅ emoji, "No active findings." caption. The Alerts tab dot in the nav is only shown when `findings.length > 0`. --- ## ⚙️ DATA PROCESSING RULES ### Call 1 — Accounts Identify the primary credit card account: the account with `type: "Credit"` and the highest transaction volume (use this account's `accountId` for Call 3). Classify all accounts: `type: "Retirement"` or `type: "Investing"` → invested assets bucket; `type: "Banking"` → liquid assets bucket; `type: "Credit"` → liability bucket. ### Call 2 — Balance History Sum `endingBalance` across all accounts for total net worth. Sum only Retirement + Investing account balances for `investedAssets`. When the same institution appears on multiple accountIds with identical balances (Plaid vs Yodlee duplication), prefer the Plaid connection and count only once. Credit account balances are negative — include them in net worth but exclude from `investedAssets`. ### Call 3 — Budget Flows (Spending Categories) **Account selection:** Use the primary credit card `accountId` identified in Call 1. Scope this call to that single account. **Step 1 — Deduplication:** Before any other processing, deduplicate the transaction list by composite key `(date + description + amount)`. If the same `(date, description, amount)` tuple appears more than once, keep only the first occurrence. This eliminates double-counting from Plaid/Yodlee aggregator overlap. **Step 2 — Exclusions:** Remove all transactions where the description matches any of the following patterns (case-insensitive): `payment thank you`, `automatic payment`, `autopay`, `purchase interest`, `interest charge`, `wire transfer fee`, `bill pay`, `advisory fee`, `thank you`. These are credit card payoff transfers and fees — not spending. **Step 3 — Large recurring transfer exclusions:** Remove any single transaction above $1,500 that recurs at the same or very similar amount (±$5) across two or more months. These are likely loan payments or balance transfers. **Step 4 — Merchant name cleaning (MERCHANT_MAP):** Before category grouping, clean each transaction's description through a `MERCHANT_MAP`. The cleaned name is the aggregation key — not the raw description. Apply at minimum: ```js const MERCHANT_MAP = [ { pattern: /amazon/i, name: 'Amazon', cat: 'Shopping' }, { pattern: /apple\.com|apple cash/i, name: 'Apple', cat: 'Subscriptions & Software' }, { pattern: /doordash/i, name: 'DoorDash', cat: 'Food & Dining' }, { pattern: /uber eats/i, name: 'Uber Eats', cat: 'Food & Dining' }, { pattern: /^uber /i, name: 'Uber', cat: 'Transportation' }, { pattern: /lyft/i, name: 'Lyft', cat: 'Transportation' }, { pattern: /starbucks/i, name: 'Starbucks', cat: 'Food & Dining' }, { pattern: /trader joe/i, name: "Trader Joe's", cat: 'Groceries' }, { pattern: /whole foods/i, name: 'Whole Foods', cat: 'Groceries' }, { pattern: /instacart/i, name: 'Instacart', cat: 'Groceries' }, { pattern: /spotify/i, name: 'Spotify', cat: 'Subscriptions & Software' }, { pattern: /netflix/i, name: 'Netflix', cat: 'Subscriptions & Software' }, { pattern: /adobe/i, name: 'Adobe', cat: 'Subscriptions & Software' }, { pattern: /openai|chatgpt/i,name: 'OpenAI', cat: 'Subscriptions & Software' }, { pattern: /petco|chewy/i, name: 'Pet Supplies', cat: 'Pets' }, { pattern: /mta|path tapp|njt|amtrak/i, name: 'Transit', cat: 'Transportation' }, ]; ``` Additional merchants should be added based on what appears in the actual transaction data. The raw `transactionCategory` field must NOT be used as the primary aggregation key. Re-categorised display labels derived from `description` and `MERCHANT_MAP` are the authoritative category for grouping and display. `transactionCategory` may be used as a fallback hint only when no `MERCHANT_MAP` rule matches and the description alone is insufficient. **Step 5 — Re-categorisation from descriptions:** For transactions not matched by `MERCHANT_MAP`, use the description to assign a category: | Description pattern | Category | |---------------------|----------| | Restaurant names, delivery services not in map | Food & Dining | | SaaS tools, streaming services, subscriptions not in map | Subscriptions & Software | | Grocery stores not in map | Groceries | | Vet, animal hospital, pet services not in map | Pets | | Transit, rideshare, airline, rail not in map | Transportation | | Retail brand names, marketplace purchases not in map | Shopping | | Hotel, Airbnb, travel agency, airline tickets | Travel | | Art galleries, theaters, film centers, escape rooms, concerts | Arts & Entertainment | | Everything else | Other | **Step 6 — Annualisation:** Sum all remaining transactions by category. Divide by the number of complete months present in the date range, multiply by 12. This produces `annualSpending` (sum of all categories) and the per-category breakdown. **Step 7 — Fixed vs discretionary classification:** - **Fixed:** Groceries, Pets, Transportation, Rent/Mortgage, Insurance, Utilities, Health - **Discretionary:** Food & Dining, Subscriptions & Software, Shopping, Travel, Arts & Entertainment, Other **Null handling:** If `get_budget_flows` returns an empty array, set `annualSpending` to `null` and display "Spending data unavailable — adjust the slider manually" on the Spending tab. Do not crash or compute with null. ### Call 4 — Investment Transactions (Income & Contributions) **Deduplication:** Apply the same `(date + description + amount)` composite key deduplication as Call 3 before any further processing. **Paycheck detection:** Regular bi-monthly `cash_deposit` entries with matching descriptions (e.g. "GUSTO PAY") into a checking account are direct deposit paychecks. Annualise: unique paycheck amount × 24 = `grossIncome`. Do not count paycheck deposits as investment contributions. If `grossIncome` is null or zero after detection, savings rate calculation must guard against division by zero — display `—%` rather than `NaN` or `Infinity`. **Contribution detection:** Sum `cash_deposit` entries into Retirement or Investing accounts only, excluding entries that match the paycheck pattern. This is `annualSavings`. **Savings rate:** `annualSavings / grossIncome`. Guard: if `grossIncome` is null or 0, savings rate = null. ### Call 5 — Performance Use `similarBenchmark.alpha` for the alpha stat. Use `totalReturn` for the 2-year return. Use `totalPnL` and `totalIncome` for the performance card subtitle. ### Call 6 — Composition Use `TraditionalAssetClasses` for the allocation card. Use `Sectors` for the sector breakdown card. The cash/equivalents percentage from `TraditionalAssetClasses` is critical — it feeds the allocation adequacy diagnosis. ### Call 7 — Equity Concentrations `weight` is a decimal fraction (0–1); multiply by 100 for percentage display. If `weight` is null for any entry, display `—%` — never compute with null. Deduplicate entries with the same ticker symbol — if the same ticker appears more than once (Plaid/Yodlee overlap), prefer the entry with the higher balance and discard the duplicate. Display up to 8 rows sorted by balance descending. If `securityName` is null, display the `symbol` only. If both are null, skip the row. ### Call 8 — Findings Classify findings by `findingName`: - `FundWithLowRankedPerformanceComparedToPeers`, `AccountWithPerformanceBelowBenchmark`, `AccountWithPerformanceStreakBelowBenchmark` → warn (amber card) - `UnmetExchangeListingRequirements` → risk (rose card) - Connection quality, fee, data completeness findings (e.g., `BetterInstitutionConnectionAvailable`) → info (grey card) - Any unrecognised `findingName` → warn (amber card, safe fallback) Sort alert cards in the Alerts tab: risk first, then warn, then info. --- ## 🔢 FIRE CALCULATIONS Define all constants at the top of `<script>` in a clearly labelled block. Initialize all UCD-derived constants to `null`. Guard: if either UCD constant is null when calculations run, display an error state and do not compute. ```js // ── UCD CONSTANTS — initialized to null; guard clauses below prevent null propagation ── const CUR_AGE = null; // {{UCD:CURRENT_AGE}} const RET_AGE = null; // {{UCD:TARGET_RETIREMENT_AGE}} // ── MCP-DERIVED VALUES — populated from live data at session time ── let investedAssets = null; let annualSpending = null; let annualSavings = null; let grossIncome = null; // ── FIXED ASSUMPTIONS — all exposed as named constants, none inline ── const SWR = 0.04; // 4% safe withdrawal rate -- locked const INFL = 0.02; // 2% annual spending inflation const DEF_RATE = 0.07; // 7% nominal -- default slider value const PES_RATE = 0.05; // 5% -- pessimistic scenario (fixed, not slider-driven) const BOOST = 15000; // $15K/yr -- boost scenario additional savings (fixed) const YRCNT = 25; // projection window in years ``` Note: JavaScript `<script>` block must contain only printable ASCII characters (0x20–0x7E, plus tab and newline). No Unicode em-dashes, box-drawing characters, arrows, or decorative separators inside `<script>` blocks. Use `--` for double-dash comments. **FIRE Number (inflation-adjusted):** ```js const fireNum = (sp, ra, ca) => (sp * Math.pow(1 + INFL, ra - ca)) / SWR; ``` **Barista FIRE:** ```js const barista = sp => (sp * 0.5) / SWR; ``` **Coast FIRE required:** ```js const coast = (sp, ca2, ca, r) => ca2 <= ca ? null : fireNum(sp, ca2, ca) / Math.pow(1 + r, ca2 - ca); ``` **Years to target (compound growth loop):** ```js function yrsTo(inv, sv, r, tgt) { // Compound growth + annual contribution loop; returns null if target not reached in 60 years let v = inv; for (let i = 1; i <= 60; i++) { v = v * (1 + r) + sv; if (v >= tgt) return i; } return null; } ``` **Portfolio series (N-year projection):** ```js function series(inv, sv, r, n) { // Returns array of portfolio values from year 0 to year n const d = [inv]; let v = inv; for (let i = 1; i <= n; i++) { v = v * (1 + r) + sv; d.push(Math.round(v)); } return d; } ``` **Format helpers:** ```js // Dollar format: $1.23M / $456K / $789 -- never raw JS floats function fm(n) { if (n == null) return '--'; const a = Math.abs(n), s = n < 0 ? '-' : ''; if (a >= 1e6) return s + '$' + (a / 1e6).toFixed(2) + 'M'; if (a >= 1e3) return s + '$' + Math.round(a / 1e3) + 'K'; return s + '$' + Math.round(a); } // Percentage format: always toFixed(1) -- never raw float function fp(r) { return r == null ? '--' : (r * 100).toFixed(1) + '%'; } ``` **Extract any repeated logic into named functions or shared constants — do not duplicate code blocks.** **Savings rate spectrum pin position:** - Pin left % = `clamp((savingsRate / 0.50) * 100, 0, 100)` - Color and context label per the Conditional Logic table in the Design System Recalculate and re-render everything (header stats, Overview, Path fan + milestones + chart, Spending rate) whenever any slider changes. --- ## 🖥️ INTERACTION SPEC | Interaction | Element | Behaviour | |------------|---------|-----------| | Drag | Spending slider (Path + Spending tabs, synced) | Recalculate FIRE number, milestones, chart, scenario fan | | Drag | Savings slider (Path tab) | Recalculate savings rate, years to FIRE, chart | | Drag | Return rate slider (Path tab) | Recalculate all projections | | Click / Enter / Space | Milestone card | Expand/collapse description; toggle `aria-expanded` | | Click | Tab button | Switch active panel; `aria-selected` updated | | Arrow Left/Right | Tab nav keyboard | Move focus + switch tab | | Hover | Chart | Chart.js tooltip: white bg, `#e4e0d9` border | | Click | "Spending tab" / "Portfolio tab" inline links in Overview | Navigate to that tab via `sw(n)` | --- ## ♿ ACCESSIBILITY - All interactive `<div>` elements: `role="button"`, `tabindex="0"`, Enter/Space handlers - Milestone cards: `aria-expanded` toggled on open/close - Sliders: `<label>` linked via `for`/`id`, `aria-valuetext` updated on every `input` - Progress bars: `role="progressbar"`, `aria-valuenow` updated dynamically - Tabs: `role="tablist"` on nav, `role="tab"` on buttons, `role="tabpanel"` on panels, `aria-selected` toggled, Arrow Left/Right navigation - Decorative elements: `aria-hidden="true"` - On init: `document.getElementById('p-0').focus()` — set `tabindex="-1"` on panels --- ## 🔧 CODE QUALITY - `const` and `let` only — no `var` - All colours as CSS custom properties — no raw hex outside `:root` (exception: Chart.js canvas values, which are documented in the Visualization Spec) - Font families as CSS variables (`--font-num`, `--font-body`) referenced throughout - UCD constants in a labelled block at top of `<script>`, initialised to `null` - Guard clauses prevent null propagating into calculations - Dynamic values via `textContent`, not `innerHTML` - **Dynamic lists (account rows, alert cards, spending category rows, equity concentration rows) built using `createElement → textContent → setAttribute → addEventListener → appendChild`. No `innerHTML` string concatenation for content derived from MCP responses.** If static chrome strings must use `innerHTML`, an `esc(str)` HTML-escape helper must be present and applied to every dynamic value inserted that way. - No `console.log` statements outputting financial data - No `localStorage`, `sessionStorage`, or cookies - No `eval()`, `Function()`, or `document.write()` - All computed layout values clamped: `Math.min(100, Math.max(0, value))` - **Extract any repeated logic into named functions or shared constants — do not duplicate code blocks** - Brace and parenthesis balance verified before finalising: `{` count equals `}` count; `(` count equals `)` count - Plain-English comment on every function and major code block - All thresholds, durations, and magic numbers defined as named constants — no inline magic numbers - Destroy previous Chart.js instance before re-rendering: `if (chart) chart.destroy()` - JavaScript `<script>` block must contain only printable ASCII characters (0x20–0x7E, plus tab and newline). No Unicode em-dashes, box-drawing characters, or decorative separators. --- ## 🔒 SECURITY & PRIVACY REVIEW **Data Exposure** - [ ] No hardcoded personal data (name, account IDs, real balances, real tickers as filter values) in prompt or generated code - [ ] All portfolio values rendered at runtime from MCP responses — no static financial data baked into HTML - [ ] No `console.log` statements that output financial data **Injection & XSS** - [ ] Dynamic values inserted via `textContent`, not `innerHTML`, for all MCP-derived content - [ ] No `eval()`, `Function()`, or `document.write()` in generated code - [ ] If `innerHTML` is used for any static chrome, an `esc()` HTML-escape helper is present and applied to every dynamic value - [ ] All external scripts load only from `fonts.googleapis.com` and `cdnjs.cloudflare.com` — no other external origins **Storage & Transmission** - [ ] No `localStorage`, `sessionStorage`, or cookie use for financial data - [ ] No unauthorized external endpoints — all data comes from Truthifi MCP - [ ] No runtime Anthropic API calls from browser code **Scope & Least Privilege** - [ ] `const` and `let` only — no `var` - [ ] No APIs accessed beyond the 8 Truthifi MCP tools listed above **UCD-Specific** - [ ] No original session ages or personal data appear in the distributed prompt — only `{{UCD:CURRENT_AGE}}` and `{{UCD:TARGET_RETIREMENT_AGE}}` placeholders - [ ] Both UCD placeholders confirmed present in prompt body and JS constants block - [ ] JS UCD constants initialized to `null` — guard clauses prevent null propagating into calculations or rendering --- ## ⚠️ AI DISCLAIMER & TRUTHIFI LIABILITY STATEMENT > This prompt is published in the Truthifi Prompt Gallery. By running this prompt you acknowledge and agree that: > > - **NOT FINANCIAL ADVICE** — outputs are for informational and entertainment purposes only. > - **OUTPUTS ARE NON-DETERMINISTIC** — AI results vary between sessions. > - **SHARING IS YOUR RESPONSIBILITY** — outputs may contain real portfolio data. > - **MODIFICATIONS ARE AT YOUR OWN RISK** — altering this prompt removes Truthifi's safeguards. > - **TRUTHIFI AND ANTHROPIC ARE NOT LIABLE** for any investment decisions or outcomes. > - **FULL TERMS:** https://truthifi-connect.ai/prompt-gallery-terms The following footer must appear at the bottom of every generated file. It must never be hidden, commented out, or styled below 11px font size or at low contrast against the page background. Do not apply `display:none`, `visibility:hidden`, `opacity:0`, or any colour that reduces legibility. The `<!-- AI DISCLAIMER — Do not remove, hide, or reduce below 11px / low contrast -->` comment must appear verbatim immediately before the `<footer>` tag in the generated HTML. ```html <!-- AI DISCLAIMER — Do not remove, hide, or reduce below 11px / low contrast --> <footer style="max-width:960px; margin:0 auto; padding:20px 32px 40px; font-size:11px; color:var(--ink3); border-top:1px solid var(--b0); line-height:1.6; margin-top:0;"> <strong style="color:var(--ink2);">AI-generated. Not financial advice.</strong> Generated using live data from your Truthifi account via the Truthifi MCP. AI systems make mistakes — figures, calculations, and commentary may contain errors. Nothing here constitutes investment, tax, legal, or financial advice. Consult a qualified professional before making decisions. Subject to the <a href="https://truthifi-connect.ai/prompt-gallery-terms" target="_blank" style="color:var(--ink2);">Truthifi Prompt Gallery Terms of Use</a>. Powered by <a href="https://truthifi.com" target="_blank" style="color:var(--ink2);">Truthifi</a>. </footer> ``` --- ## 📊 EXPECTED OUTPUT A single self-contained HTML file (~1,200–1,600 lines) that opens in any modern browser with no server required. The file contains: - A light-mode, warm-neutral, near-monochrome dashboard with amber accent - A sticky header with three key numbers and a five-tab nav - **Overview tab:** plain-prose opening statement, FIRE progress bar, three metric cards, and a "where to focus" card with numbered action items - **Path tab:** three scenario sliders, scenario fan (pessimistic/base/boost), 25-year Chart.js projection with five datasets, four expandable milestone cards - **Spending tab:** spending slider with live FIRE impact, fixed/discretionary stacked bar, category breakdown, savings rate spectrum - **Portfolio tab:** allocation adequacy diagnosis (leads with conclusion), tax account composition, cash runway, performance stats, sector breakdown, top equity concentrations, accounts list - **Alerts tab:** findings rendered as alert cards (rose for risk, amber for warn, grey for info), with dot indicator in tab nav - Sliders on Path and Spending tabs are synced for the spending input - An always-visible AI disclaimer footer No portfolio data is hardcoded. All values render from MCP responses pulled at session time. --- ## 💡 TIPS & VARIATIONS - **Narrow to retirement accounts:** Filter `get_balance_history` and `get_composition` to Retirement-type accounts to see your tax-advantaged FIRE trajectory in isolation. - **Change the projection window:** Edit `YRCNT` to 35 to see Coast FIRE trajectories more clearly on the chart. - **More conservative withdrawal rate:** Change `SWR = 0.035` for a 3.5% rule — FIRE number increases ~14%. - **Widen the boost scenario:** Change `BOOST = 25000` to model a larger savings increase. - **Re-run annually:** Update age answers each year to shift all milestone years forward. --- ## 🏷️ TAGS `fire`, `financial-independence`, `retirement-planning`, `portfolio`, `net-worth`, `projections`, `interactive-dashboard`, `tabbed`, `restrained-design` --- ## STEP 0 — TERMS ACKNOWLEDGEMENT Before proceeding, display this message verbatim: > 👋 Before we get started — this prompt is part of the Truthifi Prompt Gallery. > By continuing, you confirm you've read and agree to the Truthifi Prompt Gallery > Terms of Use (https://truthifi-connect.ai/prompt-gallery-terms) — including that outputs > are AI-generated, not financial advice, and that Truthifi accepts no liability for > decisions made based on them. > > Type **agree** or **yes** to continue, **terms** to see the key points, or **no** to stop. **Handling:** - **Affirmative** (agree / yes / ok / sure / yep): acknowledge briefly ("Got it — let's go."), proceed to Step 1. - **"terms"**: display the five key points below, then re-ask for confirmation before proceeding: - Outputs are AI-generated and non-deterministic — results may vary between sessions - Nothing produced is financial advice — consult a qualified professional before making decisions - Your portfolio data is retrieved live via MCP for this session only — not stored or transmitted - If you modify this prompt or share its outputs, that is your responsibility - Full terms: https://truthifi-connect.ai/prompt-gallery-terms - **Decline / no / stop / skip**: respond politely ("No problem — you can review the terms at https://truthifi-connect.ai/prompt-gallery-terms whenever you're ready."), then **STOP** — do not collect UCD, do not make MCP calls, do not proceed. - **User ignores and asks to proceed**: re-present the acknowledgement — do not skip it. --- ## STEP 1 — PRIVACY NOTICE & UCD COLLECTION Display verbatim: > 🔒 To personalise your dashboard I need two things: your current age and your target retirement age. > > | # | Question | Default if skipped | > |---|----------|-------------------| > | 1 | Your current age | 30 | > | 2 | Your target retirement age | 55 | > > This information exists only in this conversation — not stored, logged, or shared anywhere. Ask one question per message. Validate: age must be an integer 18–70; retirement age must be an integer greater than current age and ≤ 70. Apply defaults if the user types "skip" or if the response is outside the valid range, and note the substitution. --- ## STEP 2 — CONFIRM AND PROCEED Display: > ✅ Got it: age **{{UCD:CURRENT_AGE}}**, retiring at **{{UCD:TARGET_RETIREMENT_AGE}}**. Pulling your data now… Then make all 8 MCP calls (run in parallel where possible) and build the dashboard per the instructions above. --- ## MAIN INSTRUCTION Make all 8 MCP calls using the parameters in the MCP Dependencies table above. Use today's date as the `to` date; compute all relative `from` dates dynamically — never hardcode year values. Process the data per the Data Processing Rules section. Then generate a single self-contained HTML file implementing the full design, tab architecture, and Code Quality requirements described above. The file must include the `<!-- AI DISCLAIMER -->` comment and footer HTML block verbatim.
How to use this
Connect your accounts through Truthifi, then run this prompt in any AI that supports your Truthifi MCP. The AI will ask two questions: your current age and your target retirement age. Then it pulls eight data sources in parallel and builds the file. What you get: a five-tab dashboard. Overview leads with a plain-prose assessment of your situation and two specific things to focus on. Path gives you three scenario sliders and shows a 25-year projection across pessimistic, base, and boost scenarios. Spending breaks down where your money actually goes and shows your savings rate on a spectrum. Portfolio leads with an allocation diagnosis specific to your timeline. Alerts surfaces anything that needs attention. Sliders are live: drag spending down and watch your FIRE date move in real time.
Why it matters
Most retirement calculators ask you to fill in the numbers yourself. This one starts with what your accounts actually show. That distinction matters more than it sounds, because the gap between what people think they spend and what their credit card transactions show is often the thing standing between them and their FIRE date. The dashboard is also structured around a principle most financial tools ignore: every tab leads with the diagnostic conclusion, not the raw data. You shouldn't have to scroll past a sector allocation chart to find out whether your savings rate is on track.
Not advice
This dashboard uses your real data to run standardized FIRE calculations. It doesn't know your complete financial picture: your tax situation, Social Security projections, whether you have dependents, or what your healthcare costs in early retirement might look like. The projections are models, not predictions. They're useful for understanding the levers and roughly where you stand. They're not a plan you should act on without a broader conversation. Outputs are AI-generated and for informational purposes only. They are not financial advice. Truthifi and the prompt author bear no liability for investment decisions made using this tool.