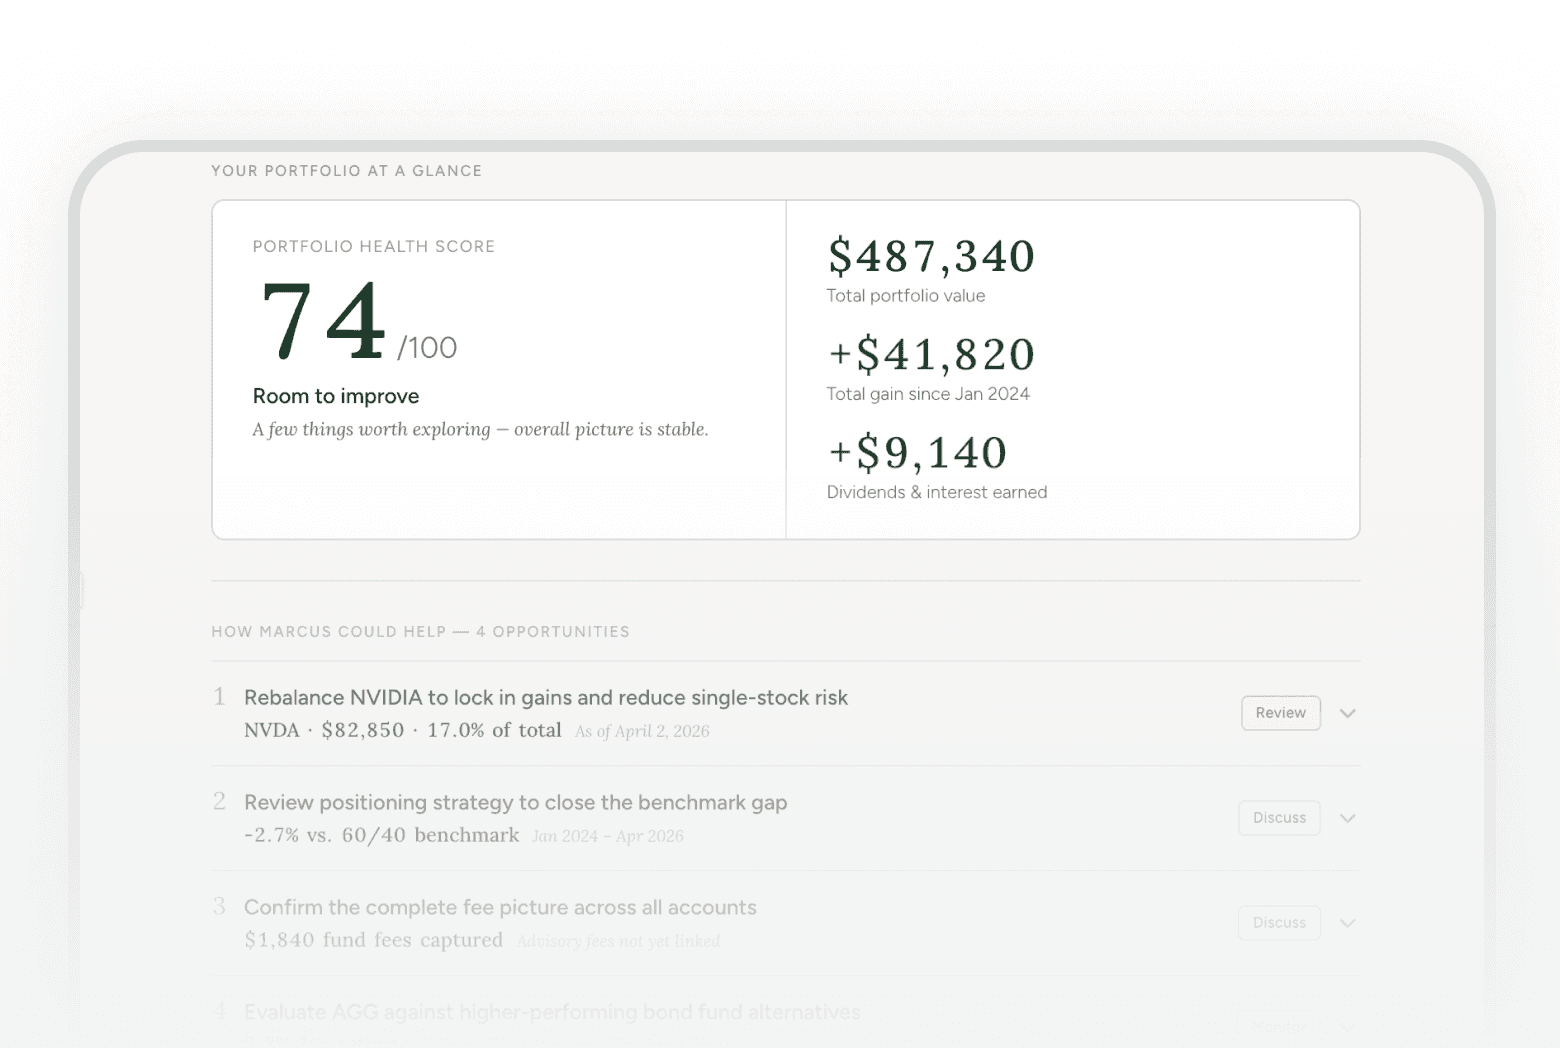

This prompt assembles a four-section advisor prep document from your live Truthifi data: where you stand, what you own, how you've performed against a benchmark, and what needs a conversation. It calculates your holdings' true portfolio weight, not just their share of classified equities.
how to prepare for a financial advisor meeting
AI tool to build advisor prep document from portfolio data / what to bring to financial advisor meeting
About this prompt
Most people show up to financial advisor meetings without a clear picture of their own portfolio. This prompt pulls your live account data and builds a clean four-section HTML document you can review before you walk in the door.
Prompt details
# Advisor Prep Sheet **Prompt version:** 1.1.0 | **Compatible with:** Truthifi MCP **Author:** Truthifi | **Gallery:** truthifi-connect.ai/prompt-gallery --- > **How to use:** Paste this entire prompt into a new Claude chat that has the Truthifi MCP connected. Follow the intake steps. Claude will fetch your live portfolio data and produce a self-contained HTML file you can open in any browser. > ━━━━━━━━━━━━━━━━━━━━━━━━━━━━━━━━━━━━━━━━━━━━━━━━━━━━━━━━ > **NOT FINANCIAL ADVICE** — This output is for informational and conversational purposes only. It does not constitute investment advice, a recommendation to buy or sell any security, or a solicitation of any kind. > **YOUR DATA** — This prompt accesses your connected Truthifi accounts to generate a personalized view. No data is stored, transmitted, or shared beyond your current session. > **SHARING** — If you share the generated HTML file, it will contain your portfolio data. Only share with people you intend to share that information with. > **MODIFICATIONS** — If you modify this prompt or the generated output, Truthifi and Anthropic are not responsible for the accuracy or safety of the result. > **LIABILITY** — Truthifi and Anthropic are not liable for any financial decisions made on the basis of this output. Always consult a qualified financial professional before acting on any investment information. > Full terms: https://truthifi-connect.ai/prompt-gallery-terms > ━━━━━━━━━━━━━━━━━━━━━━━━━━━━━━━━━━━━━━━━━━━━━━━━━━━━━━━━ --- ## 🎯 GOAL Generate a single self-contained HTML file called **Advisor Prep Sheet** — a clear, honest picture of the user's portfolio designed to be reviewed with a financial advisor. The output follows a four-section narrative arc: (1) portfolio snapshot, (2) what they own, (3) how they're performing vs. a benchmark, and (4) what needs attention. It is not a trading tool, not a full portfolio management dashboard, and contains no calls to action the user cannot act on. --- ## 📋 CONTEXT & BACKGROUND Financial advisors open client meetings with a predictable ritual: where you stand, what you own, how you're doing, and what to talk about. Most clients arrive without a clear picture of any of these. This prompt generates a single-page document that answers all four questions using live Truthifi MCP data, written in plain English for a consumer audience — not an institutional one. Key design decisions baked into this prompt: - **Portfolio value comes from `get_balance_history`**, not `get_equity_concentrations`. The equity concentration endpoint returns classified equity positions only — it is not a proxy for total portfolio value. Displaying it as such is a data-scope error. - **Performance `totalReturn` is a percentage** (e.g., `0.054` = 5.4%). Display as `(value * 100).toFixed(1) + "%"`. Never display the raw decimal. - **Alpha from `similarBenchmark.alpha` is a signed decimal** (e.g., `-0.069` = -6.9%). Compute benchmark return as `totalReturn - alpha`. Display both as formatted percentages. - **Fees are summed across all accounts** from `get_fees`. Display total only; do not itemize by account ID. - **`get_equity_concentrations` weights are scoped to classified equities only — not the whole portfolio.** The `weight` field represents each holding's share of the equity slice Truthifi can classify, which is typically a small fraction of total portfolio value. A holding showing `weight: 0.35` does not mean it is 35% of the total portfolio — it means it is 35% of classified equities. To display a holding's true share of the total portfolio, use `balance` from `get_dated_holdings` divided by total portfolio value from `get_balance_history`. Never display `weight` from `get_equity_concentrations` as a percentage of total portfolio value. - **Findings about concentration risk surfaced by Truthifi** (e.g., a high `weight` in `get_equity_concentrations`) should be verified against the true portfolio weight before being shown to the user. A finding that looks alarming within the equity scope may be immaterial as a fraction of the full portfolio. - **No fake CTAs.** Do not include buttons, links, or calls to action that do not function in the delivered HTML file. --- ## 🔌 TRUTHIFI MCP DEPENDENCIES | Tool | Purpose | Key parameters | |------|---------|----------------| | `get_balance_history` | Total portfolio value across all accounts | `dateRange` = last 2 days; `include: ["accountId","endingBalance"]` | | `get_performance_history` | Return, income, P&L, benchmark alpha | `aggregate: true`; `dateRange` = `{{UCD:START_DATE}}` to today; `include: ["totalReturn","totalIncome","totalPnL","similarBenchmark"]` | | `get_fees` | Total fees paid across all accounts | `dateRange` = `{{UCD:START_DATE}}` to today; `include: ["totalFees","advisoryFeesTotal","fundFeesTotal","maintenanceFeesTotal"]` | | `get_equity_concentrations` | Identify top holdings by symbol (ranking only — weights are equity-scoped, not portfolio-scoped) | `date` = today; `include: ["securityName","symbol","weight","balance"]`; `sort` by weight desc; `limit: 8` | | `get_dated_holdings` | True dollar balance per holding for accurate portfolio-weight calculation | `dateRange: { from: today, to: today }`; `include: ["symbol","securityName","securityType","balance"]`; `accountIds: null` | | `get_findings` | Active portfolio findings for triage | `include: ["findingName","description","findingDetails"]` | | `get_truthifi_score_history` | Most recent Truthifi score | `dateRange` = last 30 days; `include: ["truthifiScore","date"]`; `sort` by date desc; `limit: 1` | **Call sequence:** Execute all seven calls in parallel after UCD intake is complete. Do not begin HTML generation until all seven responses are received. --- ## 🙋 USER-CAPTURED DATA REGISTRY | Field name | Plain-English description | Example value | Required? | Default if skipped | |------------|--------------------------|---------------|-----------|-------------------| | `START_DATE` | The start of the performance review period in ISO 8601 format. Used as the `from` date in performance and fee lookups. | `2024-01-01` | Yes | — | | `ADVISOR_NAME` | The name of the advisor this prep sheet is being prepared for. Appears in the page header. | `Your Advisor` | No | `Your Advisor` | --- ## 🎨 DESIGN SYSTEM ### Color palette ```css :root { /* Backgrounds */ --color-bg: #F7F6F2; --color-surface: #FFFFFF; --color-border: rgba(0, 0, 0, 0.08); --color-border-md: rgba(0, 0, 0, 0.13); /* Text */ --color-text: #1A1916; --color-text-2: #6B6960; --color-text-3: #9A9890; /* Semantic / status */ --color-red: #B03A2E; --color-red-bg: #FDF0EE; --color-red-border: #EAB8B2; --color-amber: #8A5C1A; --color-amber-bg: #FDF5E8; --color-amber-border: #E8C97A; } @media (prefers-color-scheme: dark) { :root { --color-bg: #141412; --color-surface: #1C1C1A; --color-border: rgba(255, 255, 255, 0.08); --color-border-md: rgba(255, 255, 255, 0.13); --color-text: #EDECEA; --color-text-2: #8A8880; --color-text-3: #5A5856; --color-red: #D96B5E; --color-red-bg: #2A1614; --color-red-border: #4A2420; --color-amber: #D4A050; --color-amber-bg: #231A0E; --color-amber-border: #4A3418; } } ``` ### Typography | Role | Font family | Weight | Size | Notes | |------|------------|--------|------|-------| | Display / wordmark | Lora (serif) | 400, 500 | 15px–72px | Google Fonts. Used for large numbers, wordmark, score. Conveys considered authority. | | Body / UI | Figtree (sans-serif) | 300, 400, 500 | 10px–14px | Google Fonts. Clean and approachable for labels and body copy. | Font load URL: `https://fonts.googleapis.com/css2?family=Lora:ital,wght@0,400;0,500;1,400&family=Figtree:wght@300;400;500&display=swap` ### Type scale | Element | Font | Size | Weight | Line height | |---------|------|------|--------|-------------| | Score / hero number | Lora | 64px | 500 | 0.9 | | Stat value (large) | Lora | 26px | 500 | 1.1 | | Stat value (small) | Lora | 18px | 500 | 1.1 | | Section heading (eyebrow) | Figtree | 9px | 500 | — | | Body / finding text | Figtree | 12–13px | 300–500 | 1.5–1.6 | | Label / caption | Figtree | 10–11px | 300–400 | — | | Footer / disclaimer | Figtree | 11px minimum | 300 | 1.5 | ### Spacing & layout | Property | Value | |----------|-------| | Page max-width | 760px, centered | | Page padding | 28px 32px 64px | | Section gap | 24px | | Section heading bottom margin | 10px | | Card internal padding | 20px 24px | | Divider | 1px solid var(--color-border) | ### Component styles - **Stat card** — white surface, 1px border, border-radius 8px, Lora number + Figtree label - **Urgent finding card** — red-bg fill, red-border border, border-radius 8px, 16px 20px padding - **Discussion finding row** — border-top only, 10px vertical padding, 3-column grid (rank / content / tag) - **Gap strip** — 4-column equal grid, 1px border, border-radius 6px, each cell 10px 14px padding - **Tag** — 9px Figtree, 3px 9px padding, border-radius 4px, 1px border. Variants: discuss (bg surface, text-2), act-now (red fill, white text), monitor (bg surface, text-3) - **Holdings row** — 2-column grid (identity / bar+pct), border-top, 10px vertical padding ### External references (load in this order) 1. `https://fonts.googleapis.com/css2?family=Lora:ital,wght@0,400;0,500;1,400&family=Figtree:wght@300;400;500&display=swap` 2. `https://cdnjs.cloudflare.com/ajax/libs/Chart.js/4.4.1/chart.umd.js` --- ## 🖼️ VISUALIZATION SPEC ### Performance chart - **Type:** Line chart (Chart.js) - **Canvas wrapper:** `position: relative; height: 180px` - **Datasets:** - Portfolio: solid line, 2px, `var(--color-text)`, with very light fill - Benchmark: dashed line `[5,4]`, 1px, `var(--color-text-3)`, no fill - **Data:** Monthly cumulative return data points from `{{UCD:START_DATE}}` to today, constructed from the `totalReturn` figure. Display benchmark cumulative return by computing `totalReturn - alpha` for the endpoint and interpolating proportionally. - **Axes:** x = month labels (max 8 ticks, autoSkip), y = `+N.N%` formatted. No borders. Light grid on y-axis only. - **Tooltip:** `mode: "index"`, shows both series. Custom tooltip styled to match design system (white bg light mode, dark bg dark mode). - **Legend:** Custom HTML only. No Chart.js default legend. ### Gap strip (below chart) Four equal cells, left to right: 1. Your return (`totalReturn * 100`) 2. Benchmark return (`(totalReturn - alpha) * 100`) 3. Difference (`alpha * 100`, colored red if negative) 4. Total fees paid (summed from `get_fees`) All values formatted to one decimal place for percentages, two decimal places for dollars. ### Holdings bars Simple horizontal bars per holding. Bar width = `weight * 100%` relative to max holding weight (COMP = 100% of track). Track is 3px tall, border-radius 2px. Below the track: weight as percentage label. Red fill for any holding with an active `UnmetExchangeListingRequirements` finding. --- ## ⚙️ CONFIGURATION OPTIONS | Option | Description | Default | |--------|-------------|---------| | `START_DATE` | Review period start. Controls performance and fee date range. | Required — no default | | `ADVISOR_NAME` | Name shown in the page header subtitle. | `Your Advisor` | | Number of holdings shown | Always shows top 8 by weight from `get_equity_concentrations`. Not configurable. | 8 | | Findings displayed | All active findings from `get_findings`, no category filter. Urgent findings (exchange listing) shown first. | All findings | --- ## 📝 THE PROMPT Copy and paste everything below this line into a new Claude chat with Truthifi MCP connected. --- **STEP 0 — TERMS** Before doing anything else, display this message exactly: > This prompt will access your connected Truthifi portfolio data and generate a personalized HTML file. Please confirm you have read and agree to the Truthifi Prompt Gallery Terms (https://truthifi-connect.ai/prompt-gallery-terms) before continuing. > > - Type **agree** to continue > - Type **terms** to see a summary of the key points > - Type **decline** to stop Then wait for the user's response and follow exactly one of these three paths: - If the user types **agree** (or any clear affirmative) → proceed to Step 1. - If the user types **terms** → display this summary, then re-ask Step 0: > **Key points:** (1) This output is not financial advice. (2) Your data is only used in this session. (3) If you share the HTML file, it will contain your portfolio data. (4) Truthifi and Anthropic are not liable for financial decisions you make based on this output. (5) Full terms at https://truthifi-connect.ai/prompt-gallery-terms - If the user types **decline** (or any refusal) → display "Understood. No data has been accessed. Session ended." and stop. Do not proceed to any further steps. Do not proceed past Step 0 unless the user has explicitly agreed. "Start", "proceed", "go", "yes", "ok", or similar do not count as agreement — ask again if the response is ambiguous. --- **STEP 1 — COLLECT START DATE** Ask the user: > What date should we use as the start of your review period? (e.g., January 1, 2024 — or the date you opened your accounts) Wait for the user's response. Parse the response into an ISO 8601 date string (YYYY-MM-DD) and store it as `START_DATE`. If the user's input cannot be parsed into a valid date, ask again with an example. --- **STEP 2 — COLLECT ADVISOR NAME (OPTIONAL)** Ask the user: > What's your advisor's name? (We'll add it to the header — or just press Enter to skip) If the user provides a name, store it as `ADVISOR_NAME`. If the user skips or says nothing useful, set `ADVISOR_NAME` to `"Your Advisor"`. --- **STEP 3 — NULL GUARD** Before making any MCP calls, confirm both of the following are true: - `START_DATE` is a valid ISO 8601 date string in the format YYYY-MM-DD - `START_DATE` is not in the future If either check fails, ask the user to correct the value before continuing. Do not proceed until both checks pass. --- **STEP 4 — FETCH DATA** Make all seven of the following Truthifi MCP calls. Execute them in parallel. Do not begin HTML generation until all seven have returned. Today's date as ISO 8601: use the actual current date from your context. 1. `get_balance_history` — `dateRange: { from: <yesterday>, to: <today> }`, `include: ["accountId", "endingBalance"]`, `accountIds: null` 2. `get_performance_history` — `dateRange: { from: START_DATE, to: <today> }`, `include: ["totalReturn", "totalIncome", "totalPnL", "similarBenchmark"]`, `aggregate: true`, `accountIds: null` 3. `get_fees` — `dateRange: { from: START_DATE, to: <today> }`, `include: ["totalFees", "advisoryFeesTotal", "fundFeesTotal", "maintenanceFeesTotal"]`, `accountIds: null` 4. `get_equity_concentrations` — `date: <today>`, `include: ["securityName", "symbol", "weight", "balance"]`, `sort: { field: "weight", direction: "desc" }`, `limit: 8`, `accountIds: null` 5. `get_dated_holdings` — `dateRange: { from: <today>, to: <today> }`, `include: ["symbol", "securityName", "securityType", "balance"]`, `accountIds: null` 6. `get_findings` — `include: ["findingName", "description", "findingDetails"]`, `accountIds: null` 7. `get_truthifi_score_history` — `dateRange: { from: <30 days ago>, to: <today> }`, `include: ["truthifiScore", "date"]`, `sort: { field: "date", direction: "desc" }`, `limit: 1` **Data assembly rules:** - **Portfolio value:** Sum `endingBalance` across all accounts where `endingBalance > 0` from call 1. This is the only correct source for total portfolio value. Do not use any value from `get_equity_concentrations` as a portfolio total. - **Return:** `totalReturn` from call 2 is a decimal fraction. Display as `(totalReturn * 100).toFixed(1) + "%"`. - **Benchmark return:** `benchmarkReturn = totalReturn - similarBenchmark.alpha`. Display as `(benchmarkReturn * 100).toFixed(1) + "%"`. - **Alpha:** `similarBenchmark.alpha` is a signed decimal. Display as `(alpha * 100).toFixed(1) + "%"` with sign. - **Benchmark mix label:** `Math.round(similarBenchmark.equity * 100) + "/" + Math.round(similarBenchmark.fixedIncome * 100)` equity/fixed income. - **Total fees:** Sum `totalFees` across all accounts from call 3. Format as `"$" + total.toFixed(2)`. - **Truthifi score:** `truthifiScore` from the first (most recent) result of call 6. - **Holdings — symbol list:** Use `get_equity_concentrations` (call 4) only to identify which symbols to show and in what order (sorted by `weight` desc, deduplicated by symbol). Deduplicate by symbol, keeping the first non-null `securityName`. Take the top 5 symbols after deduplication. - **Holdings — true portfolio weight:** For each of the top 5 symbols, look up the total dollar balance from `get_dated_holdings` (call 5) by summing `balance` across all rows matching that symbol. Then compute `true_weight = symbol_balance / PORTFOLIO_VALUE`. This is the only correct weight to display to the user. Never display the `weight` field from `get_equity_concentrations` as a percentage of the total portfolio — it is scoped to classified equities only and will be significantly overstated for most users. - **Holdings — concentration findings cross-check:** Before surfacing any Truthifi finding that refers to concentration risk (e.g., high weight in a single position), verify the holding's `true_weight` against `PORTFOLIO_VALUE`. If the true weight is below 5%, do not surface it as a concentration concern — it is a data-scope artifact, not a real risk. - **Findings triage:** Separate findings into two groups — (A) urgent: any finding whose `findingName` contains `UnmetExchangeListingRequirements` or whose `findingDetails[].details` mentions "delisting", "minimum required price", or "listing requirements"; (B) discussion: all others. Within group B, sort by `findingName` alphabetically. If there are no urgent findings, omit the urgent card entirely. **Guard for empty responses:** - If `get_performance_history` returns an empty array or `totalReturn` is null/undefined, display a visible warning in the performance section: "Performance data unavailable for this date range." - If `get_findings` returns an empty array, display "No findings at this time." in the findings section. - If `get_equity_concentrations` returns an empty array after deduplication, display "No equity holdings data available." in the holdings section. - Never render `NaN`, `undefined`, `null`, or `Infinity` in the output. For any missing numeric value, display `"—"`. --- **STEP 5 — GENERATE HTML** Generate a single self-contained HTML file using the design system above. All CSS in a `<style>` block, all JavaScript in a `<script>` block at the end of `<body>`. No external files or fetch calls. **Required code structure:** ``` <!-- SECTION: CSS CUSTOM PROPERTIES --> :root { ... } and dark mode media query <!-- SECTION: LAYOUT & COMPONENT STYLES --> All other CSS rules <!-- SECTION: DATA CONSTANTS --> const SCORE = ...; // number const PORTFOLIO_VALUE = ...; // number (dollars) const TOTAL_RETURN = ...; // decimal fraction const BENCHMARK_RETURN = ...; // decimal fraction const ALPHA = ...; // signed decimal const TOTAL_GAIN = ...; // number (dollars) const TOTAL_INCOME = ...; // number (dollars) const TOTAL_FEES = ...; // number (dollars) const BENCHMARK_MIX = ...; // string e.g. "43/57" const ADVISOR_NAME = ...; // string const HOLDINGS = [...]; // array of {name, symbol, true_weight} objects — true_weight = holding balance / PORTFOLIO_VALUE const FINDINGS_URGENT = [...]; // array of {title, keyline, ctx, body} objects const FINDINGS_DISCUSS = [...]; // array of {rank, title, keyline, ctx, body, tag} objects // Helper: extract text-only values — use textContent not innerHTML for dynamic data function fmt_pct(decimal) { return (decimal * 100).toFixed(1) + "%"; } function fmt_dollar(n) { return "$" + n.toLocaleString("en-US", {minimumFractionDigits: 2, maximumFractionDigits: 2}); } function fmt_signed_pct(decimal) { return (decimal >= 0 ? "+" : "") + (decimal * 100).toFixed(1) + "%"; } ``` Extract all repeated logic into named functions. Do not duplicate code. Use named constants for all thresholds, bar widths, and magic numbers. All JavaScript must use only printable ASCII characters (0x20-0x7E, plus tab and newline). No Unicode box-drawing characters, em-dashes, or decorative separators in script blocks. **Page structure** — render sections in this exact order: **[TOPBAR]** - Left: wordmark "Advisor prep sheet" (Lora 15px 500) - Right: subtitle "Prepared for {ADVISOR_NAME} · {today's date formatted as Month D, YYYY}" **[SECTION 1 — Your portfolio at a glance]** Two-cell grid (score left, stats right): - Left cell: eyebrow "Portfolio health score", score number (Lora 64px), verdict text ("Strong overall" if score >= 80, "Room to improve" if score 60-79, "Needs attention" if score < 60), italic sub-note "Your portfolio is well-structured — a few things worth a closer look." (or equivalent honest variant based on score tier) - Right cell: three stats stacked — total portfolio value, total gain since `START_DATE` formatted as "since {Month YYYY}", dividends & interest earned **[SECTION 2 — What's in your portfolio]** Holdings list rows. Each row: security name (bold) + ticker and type below (muted) on the left; weight bar (3px track, fill proportional to max holding weight) + percentage label on the right. BYND or any holding with an urgent finding: red bar fill, red percentage label. **[SECTION 3 — Performance vs. a comparable benchmark]** - Eyebrow + inline legend (portfolio line swatch + benchmark line swatch) - Chart.js line chart per visualization spec above - Gap strip: four equal cells — Your return / Benchmark (mix label) / Difference / Total fees paid **[SECTION 4 — Things to discuss with your advisor]** - If FINDINGS_URGENT is non-empty: render urgent card first (red-border, red-bg, "Action needed" eyebrow, "Act now" tag) - Then render FINDINGS_DISCUSS as numbered rows (rank / content / tag) - If both arrays are empty: render "No open findings at this time." **[FOOTER — AI DISCLAIMER]** — see disclaimer section below. Do not hide, comment out, or reduce below 11px. Must appear as the last element before `</body>`. **Chart implementation:** Use Chart.js 4.4.1 loaded from `https://cdnjs.cloudflare.com/ajax/libs/Chart.js/4.4.1/chart.umd.js`. Construct the chart after the DOM is loaded. Dark mode colors resolved at runtime using `window.matchMedia("(prefers-color-scheme: dark)").matches`. Canvas must be wrapped in a `position: relative; height: 180px` div. Never set CSS height directly on the `<canvas>` element itself. Use `responsive: true, maintainAspectRatio: false`. --- ## 🔒 SECURITY & PRIVACY REVIEW Before delivering the generated HTML file, verify: **Data exposure:** - No raw MCP response objects or account IDs appear in the HTML output or in JavaScript comments - All data is rendered via `textContent` or pre-formatted string constants — never via `innerHTML` with dynamic MCP data - No `console.log` statements include portfolio values or account identifiers **XSS / injection:** - `innerHTML` is never used with any value derived from MCP response data - The only external scripts loaded are from `fonts.googleapis.com` and `cdnjs.cloudflare.com` - No `eval()` or `new Function()` calls anywhere **Storage & transmission:** - No `localStorage`, `sessionStorage`, or `IndexedDB` usage - No `fetch()` or `XMLHttpRequest` calls in the generated HTML — all data is embedded as constants at generation time - No external analytics, tracking, or telemetry scripts **Scope & correctness:** - All variables declared with `const` or `let` — no `var` - `{{UCD:START_DATE}}` and `{{UCD:ADVISOR_NAME}}` placeholders do not appear literally in the generated HTML — they must have been substituted before generation - All UCD-derived JS constants initialized to meaningful values, never left as `null` in the final output **Data completeness:** - Portfolio value is sourced exclusively from `get_balance_history` (sum of positive `endingBalance` values) — not from `get_equity_concentrations` - `totalReturn` displayed as a percentage (multiplied by 100) — never as a raw decimal - All dollar amounts formatted with `toLocaleString` or equivalent — never raw floats --- ## ⚠️ AI DISCLAIMER & TRUTHIFI LIABILITY STATEMENT **For the prompt user:** - This prompt produces an AI-generated document. It is not financial advice, a recommendation to buy or sell any security, or a solicitation of any kind. - AI outputs are non-deterministic. The same prompt may produce different results on different runs. Always verify important figures against your official account statements. - If you share the generated HTML file, it will contain your live portfolio data. Only share with people you intend to share that data with. - If you modify this prompt or its output, Truthifi and Anthropic are not responsible for the accuracy, safety, or compliance of the result. - Truthifi and Anthropic are not liable for any financial decisions made on the basis of this output. Consult a qualified financial professional before acting on any investment information. **For the generated page — fine-print footer HTML (include verbatim in every generated file):** ```html <!-- AI DISCLAIMER — Do not remove, hide, or reduce below 11px / low contrast --> <footer style="max-width:760px; margin:0 auto; padding:24px 32px 40px; border-top:1px solid var(--color-border);"> <p style="font-family:'Figtree',system-ui,sans-serif; font-size:11px; line-height:1.6; color:var(--color-text-3); font-weight:300;"> <strong style="font-weight:500; color:var(--color-text-2);">Not financial advice.</strong> This document was generated by an AI using data from your connected Truthifi accounts. It is for informational purposes only and does not constitute investment advice, a recommendation to buy or sell any security, or a solicitation of any kind. AI outputs are non-deterministic — always verify figures against your official account statements. Truthifi and Anthropic are not liable for any financial decisions made on the basis of this output. Consult a qualified financial professional before acting on any investment information. <a href="https://truthifi-connect.ai/prompt-gallery-terms" style="color:var(--color-text-2); text-decoration:underline;">Full terms</a> </p> </footer> <!-- END AI DISCLAIMER --> ``` The footer must: - Be the last element before `</body>` in every generated file - Never be commented out, hidden with `display:none`, `visibility:hidden`, or `opacity:0` - Never be styled below 11px font size or below WCAG AA contrast ratio - Use `var(--color-text-3)` and `var(--color-text-2)` from the design system for text and link color --- ## 📊 EXPECTED OUTPUT A single self-contained `.html` file that: - Opens in any modern browser with no internet connection required (except for Google Fonts and Chart.js CDN) - Renders correctly in both light and dark mode - Contains four clearly labelled sections in the narrative order described above - Shows the Truthifi score, total portfolio value, total gain, dividends & interest, top holdings by weight, cumulative return vs. benchmark chart, four-cell gap strip including total fees, and all active findings triaged by urgency - Includes the AI disclaimer footer as the last visible element - Contains no placeholder text, no `{{UCD:...}}` strings, no `null` or `NaN` values in the rendered output Approximate length: 400–600 lines of HTML/CSS/JS. --- ## 💡 TIPS & VARIATIONS - **Change the review period:** Use a different `START_DATE` to scope the view to a specific year or quarter (e.g., `2025-01-01` for year-to-date). - **Multiple advisors:** Generate separate files with different `ADVISOR_NAME` values if reviewing with more than one advisor. - **Printing:** The page is designed for screen. For a printed version, add `@media print { .topbar { position: static; } }` to the CSS. - **Sharing securely:** Consider opening the HTML file, taking a screenshot, and sharing the image rather than the raw HTML if you want to avoid sharing the source data embedded in the file. - **Data freshness:** Truthifi data is updated on a schedule. If holdings or balances look stale, re-run the prompt the following day. --- ## 🏷️ TAGS `portfolio-review` `advisor-meeting` `performance` `holdings` `fees` `findings` `html-output` `consumer` `fiduciary` `truthifi-mcp`
How to use this
Connect your accounts through Truthifi, then run this prompt in any AI that supports your Truthifi MCP. The AI will ask two questions: the start date for your review period and your advisor's name for the header. From there it fetches seven data sources in parallel: balances, performance, fees, top holdings, all holdings for accurate weight calculation, active findings, and your Truthifi health score, then generates the file. What you get: your portfolio health score and total value up front, followed by your top holdings with their true share of your portfolio, a cumulative return chart against a comparable benchmark, a four-cell gap strip showing your return, the benchmark return, the difference, and total fees paid, and a triage of active findings sorted by urgency. The file works in light and dark mode.
Why it matters
Advisor meetings are more useful when both sides of the table are working from the same picture. A document that shows your total return, what the benchmark returned, and exactly how much you paid in fees puts the conversation on firmer ground. The fee visibility piece is worth calling out. Most investors know in the abstract that they pay fees. Fewer know the actual dollar figure across all their accounts for a given period. Seeing that number next to your return and your benchmark's return tends to focus the meeting in productive ways.
Not advice
This document is a preparation tool, not a recommendation. It tells you what's in your portfolio, how it performed, what it cost, and what Truthifi has flagged, but it doesn't tell you what to do about any of it. One technical note: the holdings section shows each position's true share of your total portfolio, calculated from actual dollar balances. This is different from the weight field in Truthifi's equity concentration data, which is scoped only to classified equities. Outputs are AI-generated and for informational purposes only. They are not financial advice. Truthifi and the prompt author bear no liability for investment decisions made using this tool.