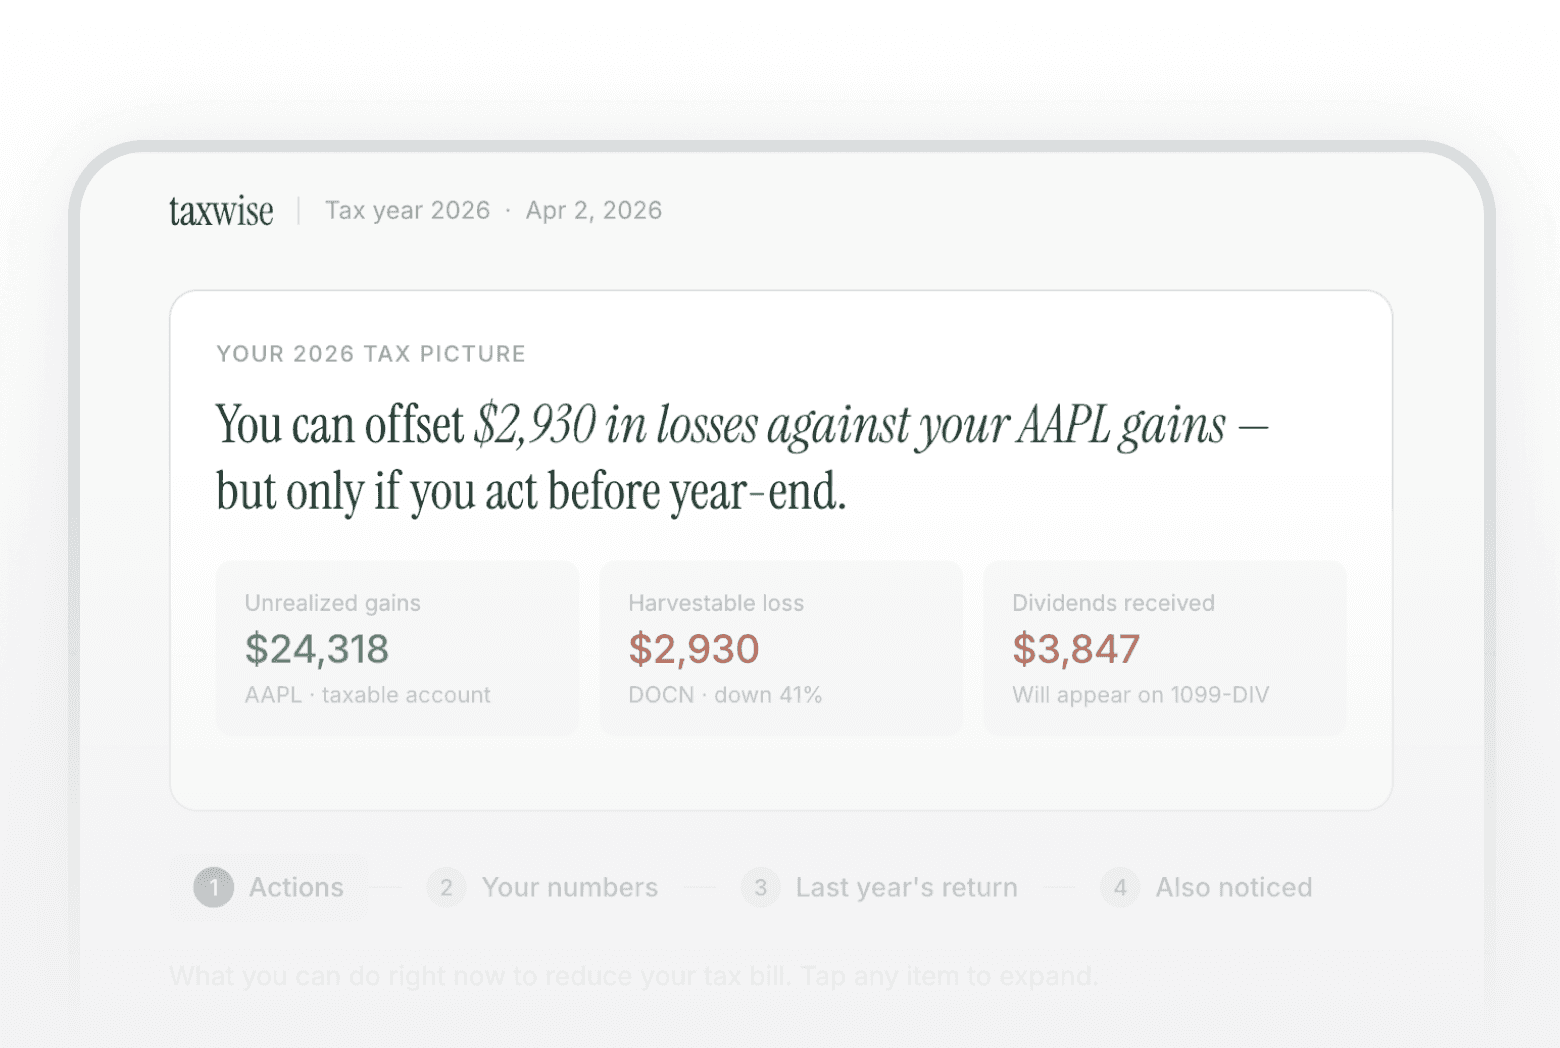

This prompt surfaces taxable dividend income, unrealized gains and losses, and year-end tax actions from your live portfolio data before your 1099 arrives. It classifies dividends as qualified or ordinary income, flags loss harvesting candidates, and lets you enter last year's Form 1040 numbers for bracket-aware calculations.
how to see unrealized gains and losses before tax season
AI tool to find dividend income in investment accounts / how to prepare for taxes with portfolio data
About this prompt
See your dividend income, unrealized gains and losses, and year-end actions before tax season hits. Built from your live Truthifi portfolio data.
Prompt details
# Truthifi Tax Prep Dashboard **Prompt version:** 1.0.0 | **Compatible with:** Truthifi MCP | **Tax year:** 2026 **Author:** Truthifi Gallery | **Date:** 2026-04-02 --- ## 🎯 GOAL Build a personalized, self-contained HTML tax prep dashboard using the user's live Truthifi portfolio data. The dashboard surfaces dividend income, unrealized gains/losses, and tax-action recommendations — prioritized by urgency — and lets the user enter last year's Form 1040 numbers to receive bracket-aware, personalized tax guidance. --- ## 📋 CONTEXT & BACKGROUND Tax prep is one of the highest-anxiety personal finance moments of the year. Most people don't know what their investment accounts are generating in taxable income until their 1099s arrive. This dashboard surfaces that picture early — before year-end — so the user can take action rather than just report history. The dashboard is organized as a narrative: *what's my situation → what should I do about it → here are the raw numbers → personalize with my prior return → anything else to know.* Non-tax findings from Truthifi diagnostics are intentionally de-emphasized so the tax signal is not diluted by portfolio health noise. The output is a single downloadable HTML file that works offline (except Google Fonts). It does not submit data anywhere, store anything server-side, or require authentication. --- ## 🔌 TRUTHIFI MCP DEPENDENCIES All three calls must be made in parallel before building the dashboard. | Tool | Required Parameters | Include Fields | Notes | |------|---------------------|----------------|-------| | `get_equity_concentrations` | `date`: today's date in ISO 8601 | `balance`, `securityName`, `symbol`, `weight` | `accountIds`: null (all accounts). `sort`: balance desc. `limit`: 20 | | `get_investment_transactions` | `dateRange.from`: 18 months before today. `dateRange.to`: today. Both ISO 8601 | `date`, `amount`, `transactionType`, `security`, `accountId` | `transactionTypes`: `["dividend_payment", "dividend_reinvestment", "long_term_capital_gain", "short_term_capital_gain", "unqualified_capital_gain", "sell", "buy"]`. `accountIds`: null | | `get_findings` | *(none required)* | `findingName`, `description`, `findingDetails` | `findingCategories`: null (all). `accountIds`: null | **Field constraint reminder:** The `include` parameter accepts only top-level field names. Do not pass nested field paths (e.g. `security.symbol` is invalid — pass `security` and extract subfields from the response). **Date handling:** Do not hardcode dates. Compute `dateRange.from` as today minus 18 months at runtime. Use today's actual date for `get_equity_concentrations`. --- ## 🙋 USER-CAPTURED DATA REGISTRY These are the only pieces of information collected from the user before building. Everything else is derived from Truthifi MCP data at runtime. | Field name | Plain-English description | Example value | Required? | Default if skipped | |------------|--------------------------|---------------|-----------|-------------------| | `TAX_YEAR` | The tax year the dashboard covers | 2026 | **Yes** | — | | `PRIOR_BRACKET` | User's prior-year federal income tax bracket (10 / 12 / 22 / 24 / 32) | 22 | No | Pre-select 22% in the UI; user can change before calculating | | `PRIOR_AGI` | Adjusted gross income from prior-year Form 1040, line 11 | 95000 | No | Leave blank; bracket-aware calculations are skipped until entered | | `PRIOR_TAX_OWED` | Federal tax owed from prior-year Form 1040, line 24 | 14000 | No | Leave blank | | `PRIOR_CAP_GAINS` | Capital gains from prior-year Schedule D, line 16 | 8000 | No | Leave blank | | `PRIOR_LOSS_CARRY` | Capital loss carryover from prior-year Schedule D, line 21 (enter as a positive number) | 3000 | No | Treated as 0 in calculations | **Only `TAX_YEAR` is required at intake.** All Form 1040 fields are optional and entered by the user inside the dashboard's Tab 3 interface — they do not need to be collected before building the file. --- ## 🎨 DESIGN SYSTEM ### Fonts Load from Google Fonts: - **Display/headline:** *Instrument Serif* (italic variant used for hero emphasis). Rationale: warm editorial authority; counters the cold, clinical feel of most tax software. - **Body/UI:** *Inter* (optical sizing variant: `opsz,wght@14..32,400;14..32,500`). Rationale: highly legible at small sizes; familiar without being generic when paired with a serif display face. - **Fallbacks:** Georgia (serif), system-ui (sans). No monospace/data font needed — all figures are formatted with `Intl.NumberFormat`, not displayed in code style. ### Color Tokens | Token | Hex | Usage | |-------|-----|-------| | `--moss` | `#2a5c45` | Primary accent, positive states, active nav, CTA buttons | | `--moss-bg` | `#eef6f1` | Tinted backgrounds for green states | | `--moss-mid` | `#7ab99a` | Borders and stripes for green cards | | `--sun` | `#92400e` | Warnings, year-end actions, ordinary income labels | | `--sun-bg` | `#fffbeb` | Tinted backgrounds for amber states | | `--sun-border` | `#fcd34d` | Borders for amber cards | | `--red` | `#991b1b` | Urgent actions, unrealized losses | | `--red-bg` | `#fef2f2` | Tinted backgrounds for red states | | `--red-mid` | `#fca5a5` | Borders and stripes for red cards | | `--blue` | `#1e40af` | Account ID pills | | `--blue-bg` | `#eff6ff` | Account pill backgrounds | | `--ink` | `#18181b` | Primary text | | `--ink2` | `#52525b` | Secondary text | | `--ink3` | `#a1a1aa` | Muted labels, footnotes | | `--paper` | `#f9f9f7` | Page background | | `--surface` | `#ffffff` | Card surfaces | | `--border` | `#e4e4e0` | All borders | ### Layout - Max width: 640px, centered. - Page padding: 28px top, 20px horizontal, 64px bottom. - Card internal padding: 14px horizontal, 12–14px vertical, consistent across all card types. - Gap between cards: 8px. - Border radius: 10px (cards), 14px (hero and large containers). ### Typography Scale | Element | Font | Size | Weight | Notes | |---------|------|------|--------|-------| | Wordmark | Instrument Serif | 21px | — | "wise" in `--moss` | | Hero headline | Instrument Serif | 26px | — | line-height 1.25, max-width 520px | | Section labels | Inter | 11px | 500 | Uppercase, letter-spacing 0.07em | | Card titles | Inter | 14px | 500 | — | | Body / expanded text | Inter | 13px | 400 | line-height 1.7 | | Meta / footnotes | Inter | 11–12px | 400 | — | --- ## 🖼️ VISUALIZATION SPEC The output is a single-page HTML dashboard with four tabbed panels navigated by a numbered step bar. ### Overall Structure (top to bottom) 1. Wordmark 2. Hero card (situation summary + 3 stat tiles + cost basis footer) 3. Step nav (tabs 1–4) 4. Active panel content --- ### Wordmark "taxwise" — "tax" in Instrument Serif, "wise" in the same font colored `--moss`. Separated from a date/context subline by a 1px vertical rule. --- ### Hero Card Opens with a **one-sentence plain-English summary** generated from the actual data. The headline must lead with the **single most actionable or valuable insight** for this specific user — not necessarily the largest number. Ask: what would a knowledgeable friend say first if they were reviewing this portfolio? A loss harvest opportunity, an upcoming deadline, or a structural tax drag may matter more than the dividend total even if dividends are the bigger dollar figure. Use `<em>` to italicize the key figure or action within the sentence. - **Strong:** *"You can offset $2,930 in losses against your AAPL gains — but only if you act before year-end."* - **Weak:** *"You have $3,847 in dividend income and two positions worth acting on."* (passive, not urgent) Below the headline, three stat tiles in a 3-column grid. **Order the tiles to reinforce the headline** — lead with the stat the headline references. The three tiles should always cover: unrealized gains/losses, the top urgent action metric, and dividends received — but their order should reflect the story the data tells. | Tile | Label | Value color | Subtext | |------|-------|-------------|---------| | Unrealized gains/losses | Dynamic — see below | `--moss` or `--red` | "Est. — no cost basis yet" if estimated | | Top action metric | Contextual (e.g. "Harvestable loss") | `--red` if urgent | Names the position or account | | Dividends received | `--sun` | `--sun` | "Will appear on 1099-DIV" | **Tile 2 — Unrealized gains/losses dynamic behavior:** - If net value ≥ 0: label reads **"Unrealized gains"**, value color `--moss` - If net value < 0: label reads **"Unrealized losses"**, value color `--red`, prefix with Unicode minus sign U+2212 (not a hyphen) - If cost basis is unavailable, prefix value with `~` and set subtext to "Est. — no cost basis yet" **Hero footer (shown when cost basis is unavailable):** Slim row below the stat tiles: amber warning badge ("⚠ Cost basis unavailable") + text "Unrealized gain/loss estimate is approximate. Connect via Plaid for exact figures." --- ### Step Nav Four numbered steps. Styling by state: | State | Circle | Label | Background | |-------|--------|-------|------------| | Active | `--moss` fill, white text | `--moss` | `--moss-bg` | | Done | `--moss-bg` fill, `--moss` text | `--moss` | none | | Inactive | `--border` fill, `--ink2` text | `--ink2` | none | Steps scroll horizontally on narrow viewports without wrapping. --- ### Tab 1 — Actions **Intro line:** "What you can do right now to reduce your tax bill. Tap any item to expand." Each action is an expandable card containing: - **4px colored left stripe:** red (`--red-mid`) = act now · amber (`--sun-border`) = year-end · green (`--moss-mid`) = before selling / housekeeping - **Title** (14px, weight 500) - **Pill row:** urgency pill + account ID pill + position pill - **Right-aligned label:** "Saves tax" or "Recurring saving" in `--ink3` - **Expanded body:** plain-English explanation (13px, line-height 1.7), bold "What to watch:" callout where relevant **Minimum actions to surface (derive from findings + data):** 1. Any position with a compliance warning or delisting risk → TLH candidate → red stripe, "Act now" 2. Any bond ETFs or money market holdings in a taxable account generating ordinary income → amber stripe, "Year-end" 3. Any connection quality issue preventing cost basis from loading → green stripe, "Before selling" --- ### Tab 2 — Your Numbers **Holdings list** (one row per security): - Ticker pill (blue `--blue-bg`/`--blue`, or red `--red-bg`/`--red` if flagged) - Full security name - Account badge(s) — abbreviated account ID as blue pill - Weight % (right-aligned) - Value (right-aligned) **Dividends section** — collapsed by account. Each account row shows: - Account ID abbreviation + account type label pill - Total dividend amount Expands to per-security rows: symbol · truncated name · Qualified / Ordinary income badge · amount **Footnote:** "Qualified dividends are taxed at your lower long-term capital gains rate. Ordinary income dividends (bond ETFs, money market) are taxed at your full income rate." --- ### Tab 3 — Last Year's Return **Intro:** "Enter four numbers from your {{TAX_YEAR_MINUS_1}} Form 1040 and we'll calculate your actual tax exposure on this portfolio." **Bracket selector:** Five buttons — 10% · 12% · 22% · 24% · 32%+ — each showing the corresponding LTCG rate. Default: pre-select the bracket matching `{{PRIOR_BRACKET}}` (default 22%). **Four number inputs (all optional):** | Label | Form 1040 reference | |-------|-------------------| | Adjusted gross income | Line 11 | | Federal tax owed | Line 24 | | Capital gains | Schedule D, line 16 | | Loss carryover | Schedule D, line 21 (enter as positive) | **Submit button:** "Calculate my {{TAX_YEAR}} plan" **Result cards (rendered on submit, green/amber/red):** | Condition | Color | Content | |-----------|-------|---------| | 0% LTCG bracket | green | Opportunity to realize gains tax-free | | Estimated capital gains tax > $0 | amber | Calculated tax owed at selected LTCG rate, net of loss carryover | | Loss carryover > $0 | green | Dollar amount available to offset gains | | Bond ETF ordinary income > $0 | amber | Estimated tax drag at ordinary rate | | AGI > $200,000 | red | NIIT surcharge (3.8%) applies; show effective combined rate | | No inputs entered | amber | Prompt to enter at least a bracket to see results | --- ### Tab 4 — Also Noticed **Intro:** "These findings came from your Truthifi diagnostics. They're not directly tax-related, but worth a look when you have a moment." Each finding: collapsible card with: - Small colored dot: amber (`--sun-border`) for moderate · gray (`--border`) for informational - Title - Account attribution meta line (abbreviated account ID + account type) - Expanded plain-English explanation --- ### Expandable Behavior (all panels) - All expandable elements use a `›` chevron - On open: chevron rotates 90° via `transform: rotate(90deg)` - Toggle is class-based on the body element only — do not use `display:none` toggling on the trigger row ### Account ID Display Abbreviate all account IDs to the last 2–3 characters prefixed with `···` (e.g. `···Oz`). Display as small pills with `--blue-bg` background and `--blue` text wherever an insight, holding, or dividend row is tied to a specific account. --- ## ⚙️ CONFIGURATION OPTIONS | Option | Default | How to change | |--------|---------|---------------| | Tax year label | Derived from `{{TAX_YEAR}}` | Change `TAX_YEAR` at intake | | Default bracket pre-selection | 22% | Change `PRIOR_BRACKET` UCD or update the `br.on` class in the HTML | | Number of holdings shown | Top 20 by balance | Change `limit` in `get_equity_concentrations` call | | Transaction lookback window | 18 months | Adjust `dateRange.from` offset | | Page max width | 640px | Change `.page` max-width in CSS | --- ## 📝 THE PROMPT > **Truthifi Gallery** — This prompt is shared for personal use. By using it you agree that: (1) all output is for informational purposes only and does not constitute financial or tax advice; (2) you will not redistribute this prompt commercially without permission; (3) Truthifi and the prompt author are not liable for decisions made based on dashboard output. > ━━━━━━━━━━━━━━━━━━━━━━━━━━━━━━━━━━━━━━━━━━━━━━━━━━━━ --- ### Step 0 — Terms Acknowledgement Before doing anything else, display this message to the user and wait for a response: > "This dashboard uses your live Truthifi portfolio data to build a personalized tax prep view. Output is for informational purposes only — it is not tax advice. A fine-print disclaimer will appear in the footer of the generated file. > > To continue, reply **yes** to confirm you understand, or **no** to cancel." - If the user replies **yes** (or any clear affirmative): proceed to Step 1. - If the user replies **no** (or any clear negative): reply "No problem — the dashboard has not been built. Let me know if you'd like to try again." and stop. - If the user's response is ambiguous: ask once more — "Just to confirm — would you like me to proceed and build the dashboard? Reply yes or no." --- ### Step 1 — Collect Required UCD Ask the user: > "What tax year should this dashboard cover?" Wait for their response and store it as `{{TAX_YEAR}}`. If the user does not provide a year or says something like "current year" or "this year", infer the current tax year from today's date and confirm: *"I'll set the tax year to [YEAR] — is that right?"* --- ### Step 2 — Optional UCD (offer, don't require) Say: > "I'll also fetch your Truthifi data now. Before I do — do you have last year's Form 1040 handy? If so, I can pre-fill the bracket selector in the dashboard. Just share your tax bracket (10%, 12%, 22%, 24%, or 32%+) and I'll set it as the default. You can always change it later inside the dashboard." - If they provide a bracket, store as `{{PRIOR_BRACKET}}`. - If they skip or say they don't have it, proceed with the 22% default. - Do **not** ask for AGI, tax owed, capital gains, or loss carryover here — those are entered inside the dashboard UI in Tab 3. --- ### Step 3 — Fetch Data Fetch all three data sources **in parallel**: **Call 1 — `get_equity_concentrations`** ``` date: [today's date in ISO 8601] include: ["balance", "securityName", "symbol", "weight"] sort: { field: "balance", direction: "desc" } limit: 20 accountIds: null ``` **Call 2 — `get_investment_transactions`** ``` dateRange: { from: [today minus 18 months, ISO 8601], to: [today, ISO 8601] } include: ["date", "amount", "transactionType", "security", "accountId"] transactionTypes: [ "dividend_payment", "dividend_reinvestment", "long_term_capital_gain", "short_term_capital_gain", "unqualified_capital_gain", "sell", "buy" ] accountIds: null ``` **Call 3 — `get_findings`** ``` include: ["findingName", "description", "findingDetails"] findingCategories: null accountIds: null ``` **Guard clause:** If any call returns an error or empty output, do not silently proceed. Tell the user which call failed and ask whether they'd like to retry or continue without that data source. Do not build the dashboard with a critical data gap unless the user explicitly confirms. --- ### Step 4 — Analyze Derive the following from the fetched data: **Dividends** - Sum all `dividend_payment` and `dividend_reinvestment` transaction amounts - Group by `accountId`, then by security symbol within each account - Classify each security: - **Qualified** — individual equities, broad equity ETFs (e.g. VOO, VTI, VBK, VEA, VWO) - **Ordinary income** — bond ETFs (e.g. LQD, EMB), money market funds (e.g. SPAXX), REITs (e.g. VNQ) **Unrealized gains/losses** - Sum `balance` values from `get_equity_concentrations` - Flag as estimated (`~`) if no cost basis is available (expected when connection quality is low) - Determine sign: positive = gains (green label + color), negative = losses (red label + color, Unicode minus U+2212) **Tax actions** Review findings for anything directly tax-relevant. Assign urgency: - **Red / Act now** — compliance warnings, delisting risk (TLH candidate) - **Amber / Year-end** — positions generating ordinary income in a taxable account, underperforming bond ETFs - **Green / Before selling** — connection quality issues blocking cost basis data **Non-tax findings** All remaining findings that are not directly tax-relevant. These populate Tab 4 only. --- ### Step 5 — Build the HTML File Produce a **single self-contained HTML file** following the Design System and Visualization Spec above. Requirements: - No JavaScript frameworks — vanilla HTML, CSS, JS only - No external resources except Google Fonts (loaded via `<link>`) - All numbers formatted via `Intl.NumberFormat` — no raw floats reach the screen - Unrealized gains/losses tile is fully dynamic: label and color change based on sign of the computed value - Default bracket pre-selected per `{{PRIOR_BRACKET}}` (default 22% if not provided) - Submit button in Tab 3 reads "Calculate my {{TAX_YEAR}} plan" with the actual year substituted - Fine-print disclaimer footer included (see Security & Privacy section below) - File must open correctly when double-clicked in a browser with no server or build step Offer the file as a download when complete. --- ## 🔒 SECURITY & PRIVACY REVIEW - **No data transmission:** The generated HTML file must contain no `fetch()`, `XMLHttpRequest`, form `action`, or any other mechanism that sends data to an external server. All interactivity is local JS only. - **No storage:** The file must use no `localStorage`, `sessionStorage`, `indexedDB`, or cookies. - **No personal data embedded:** All figures are derived at runtime from MCP calls. No account numbers, balances, names, or transaction data should be hardcoded into the output file. - **Disclaimer obligation:** The file must include a visible fine-print footer. Required text: ```html <div style="margin-top:40px;padding:16px 20px;border-top:1px solid #e4e4e0;font-size:11px;color:#a1a1aa;line-height:1.6;font-family:inherit"> This dashboard is for informational purposes only and does not constitute financial, tax, or legal advice. Data is sourced from Truthifi MCP and may be incomplete or estimated. Unrealized gain/loss figures are estimates and do not reflect confirmed cost basis. Consult a qualified tax professional before making financial decisions. Truthifi and the dashboard author are not liable for decisions made based on this output. </div> ``` --- ## ⚠️ AI DISCLAIMER & TRUTHIFI LIABILITY STATEMENT **This prompt and its output are for informational purposes only.** Nothing generated by this prompt constitutes financial, investment, or tax advice. The dashboard is a visual summary of data retrieved from Truthifi MCP — it does not account for your complete financial picture, state tax obligations, AMT exposure, or other individual circumstances. Unrealized gain/loss figures are estimates based on current market value without confirmed cost basis — treat them as directional only until cost basis data is connected via Plaid. Tax bracket calculations are simplified federal estimates. They do not include state income tax, NIIT at sub-threshold incomes, or tax treaty implications for non-US persons. **Always consult a qualified tax professional before making financial decisions.** Truthifi is not a registered investment advisor, broker-dealer, or tax preparer. Use of the Truthifi MCP does not create a fiduciary relationship. --- ## 📊 EXPECTED OUTPUT A single downloadable `.html` file that: - Opens in any modern browser with no server or build step required - Shows a wordmark, hero summary card, and four-tab stepped navigation - **Tab 1** surfaces 2–4 prioritized tax actions with account attribution and expandable plain-English explanations - **Tab 2** shows holdings and dividend income broken down by account and security, with Qualified / Ordinary income labels - **Tab 3** contains an interactive Form 1040 input panel that calculates bracket-aware tax exposure on submit - **Tab 4** lists non-tax Truthifi diagnostic findings in a quiet, collapsible format - Includes a fine-print disclaimer footer - Works fully offline after the initial Google Fonts load --- ## 💡 TIPS & VARIATIONS - **Dark mode:** Add `prefers-color-scheme: dark` media queries. The color token structure supports this — invert the ink/paper tokens and adjust border opacity. - **If cost basis is blocked by Yodlee:** Use Action 3 in the dashboard to guide the Plaid reconnection, then re-run this prompt to get an updated file with real gain/loss figures. - **Married filing jointly:** The NIIT threshold is $250K AGI for MFJ, not $200K. Adjust the Tab 3 calculation accordingly. - **Sharing with an advisor:** Export the file and send as an attachment. It requires no login and contains no live data connections — it's a static snapshot. - **Mid-year refresh:** Re-run this prompt at any time. Each run fetches fresh data from Truthifi MCP and regenerates the file. --- ## 🏷️ TAGS `tax-prep` `portfolio` `dividends` `capital-gains` `tax-loss-harvesting` `1099` `form-1040` `html-dashboard` `truthifi-mcp` `year-end-planning` `unrealized-gains` `unrealized-losses` `bracket-planning` `cost-basis`
How to use this
Connect your accounts through Truthifi, then run this prompt in any AI that supports your Truthifi MCP. The AI asks for the tax year, then fetches your holdings, transactions, and diagnostics in parallel. What you get: a four-tab HTML dashboard. The first tab shows prioritized actions ordered by urgency. The second breaks down your holdings and dividend income by account, with each dividend classified as qualified or ordinary income. The third lets you enter numbers from last year's Form 1040 for bracket-aware tax calculations. The fourth surfaces any other Truthifi findings worth knowing about. You only need the tax year to get started. Everything else can be filled in after the file is generated.
Why it matters
Tax season is mostly a reporting exercise. The actual decisions, harvesting a loss, realizing a gain in a low-income year, moving a bond ETF out of a taxable account, have to happen before December 31st. After that, you're just documenting what already happened. Most people don't get a clear picture of their investment tax situation until their 1099s land in January or February. By then, the window is closed. This prompt pulls that picture forward so you can see your dividend income, unrealized positions, and harvestable losses while there's still time to act.
Not advice
This prompt is a data display and calculation tool. It shows what your portfolio is generating, estimates tax exposure based on numbers you provide, and flags positions worth a conversation. It doesn't tell you what to do. Tax situations are individual. State taxes, AMT exposure, the specific lot you're selling, your complete income picture: none of that is captured here. Unrealized gain and loss figures are estimates based on current market value. The bracket calculations are simplified federal estimates only. Outputs are AI-generated and for informational purposes only. They are not financial or tax advice. Truthifi and the prompt author bear no liability for decisions made using this tool.