Wondering how to find recurring charges on Chase, Apple Card, or Fidelity? This prompt connects to all your linked accounts and surfaces every subscription automatically — no manual digging through statements. Whether you're trying to see all your subscriptions in one place, catch a forgotten subscription you're still paying for, or understand how much subscription creep has added up over time, this prompt does the work in one pass.
what subscriptions do i have
how to find all my subscriptions, how to check subscriptions, find my subscriptions, forgotten subscriptions, subscription creep, subscription audit
About this prompt
Most people can't answer a simple question: what subscriptions do I have? This prompt finds every recurring charge, flags forgotten subscriptions and price increases, and shows subscription creep over time.
Prompt details
> **How to use this prompt:** Copy everything below this line into a new chat > that has the Truthifi MCP connected (`https://api.truthifi.com/mcp`), then follow > the instructions — by doing so you agree to the > [Truthifi Prompt Gallery Terms of Use](https://truthifi-connect.ai/prompt-gallery-terms). --- ``` ━━━━━━━━━━━━━━━━━━━━━━━━━━━━━━━━━━━━━━━━━━━━━━━━━━━━━━━━━━━━ TRUTHIFI PROMPT GALLERY -- USE RESPONSIBLY ━━━━━━━━━━━━━━━━━━━━━━━━━━━━━━━━━━━━━━━━━━━━━━━━━━━━━━━━━━━━ * NOT FINANCIAL ADVICE -- AI-generated output is for informational purposes only. * YOUR DATA -- retrieved live via MCP for this session only. Not stored, logged, or transmitted beyond this conversation. * SHARING -- outputs may contain real spending data. Review before sharing publicly or with third parties. * MODIFICATIONS -- altering this prompt removes Truthifi's intended safeguards. Any such use is at your own risk. * LIABILITY -- Truthifi accepts no liability for AI-generated outputs or any decisions made based on them. By running this prompt you agree to the Truthifi Prompt Gallery Terms. Full terms: https://truthifi-connect.ai/prompt-gallery-terms ━━━━━━━━━━━━━━━━━━━━━━━━━━━━━━━━━━━━━━━━━━━━━━━━━━━━━━━━━━━━ ``` # Audit your subscriptions **Truthifi MCP Required** | MCP URL: `https://api.truthifi.com/mcp` | Version: 1.2.4 | 2026-06-08 --- ## GOAL Fetch the user's full transaction history, identify every recurring charge, surface what's changed recently, and deliver a single self-contained HTML dashboard showing: what changed (with a year-over-year area chart), a category-filtered spend breakdown with bar chart and paginated subscription list, and on-demand access to broader spending/income/transfer summaries via three panels. --- ## CONTEXT & BACKGROUND Subscriptions accumulate on autopilot — services get added, prices drift up, cancellations get delayed. This prompt identifies recurring charges by merchant + amount pattern (not by any unreliable MCP tag), surfaces what's new, ended, or more expensive, and plots cumulative spend vs the prior year so trends are visible at a glance. Key rules: - **Monthly recurring**: 2 or more charges in different months at a consistent amount (within 10%). - **Annual recurring**: consistent amount appearing approximately once per 10-14 months. - **Newly detected**: `txnCount <= 2` (only seen 1-2 times so it's just becoming a recognizable pattern), OR a known subscription brand (Netflix, Spotify, Adobe, etc.) appearing for the first time. The intent is to surface charges that are just starting to look like a recurring subscription. - **Likely canceled**: 2 or more prior charges but none in the last 60 days -- a previously regular charge that went quiet. - **Price went up**: most recent charge more than 5% above the median of prior charges. - **Sign convention**: subscriptions are costs. In the "What's changed" card, new/price-increase rows show `-$X/mo` (money leaving), canceled rows show `+$X/mo` (money saved). The headline net = ended savings minus new costs -- positive means you're spending less overall. - **Period spend**: monthly subs = `mAmt * months_in_period`; annual subs = `yAmt` if renewed within period, else show `--`. - The output is a self-contained HTML file. All subscription data is baked in as JS constants at generation time by the agent -- there are no runtime API or MCP calls from within the file. The Refresh button re-runs this prompt in the chat (it does not fetch from the file). Card 3 "Explore prompts" buttons are anchor tags that link out to Truthifi Prompt Gallery category pages. --- ## TRUTHIFI MCP DEPENDENCIES **MCP server:** `https://api.truthifi.com/mcp` | Step | Tool | Purpose | Key Parameters | |------|------|---------|----------------| | 1 | `get_transactions` | Full outflow transaction history for subscription identification and totals | First call: `maxAccountDateRanges: true` to discover per-account available date ranges. Then paginate across non-overlapping 90-day windows (the tool hard-caps each request at 90 days) covering the full available range. Each window: `budgetFlowType: "outflow"`, `include: ["accountId","date","description","amount","budgetFlowDetailCategory"]`, `pageSize: 150`. Paginate within each window using `cursor` from `nextCursor` until `hasMore` is false. | > **Note:** No MCP calls are made from within the generated HTML file at any point. All MCP calls happen here in the chat, at generation time. The Refresh button re-runs this prompt in the conversation. Card 3's "Explore prompts" buttons are `<a>` tags linking to Truthifi Prompt Gallery category pages -- they do not call `sendPrompt` or copy to clipboard. **Plan-gating note:** `get_transactions` page size is plan-gated: max 20 rows/page on Free/Connect Explore, 100 on Connect Pro/Monitoring, 150 on Connect Max/Monitoring Plus+. Always pass `pageSize: 150` and paginate fully -- users on lower plans will receive fewer rows per page but pagination will still cover all data across more pages. **Null guard:** If step 1 returns empty or errors, stop and show: "No spending data found. Check your Truthifi connections and try again." **Parsing:** Extract data from `mcp_tool_result` content blocks by type. Never parse raw MCP output with regex. Never rely on block position. --- ## USER-CAPTURED DATA REGISTRY No user input required. Runs entirely on live MCP data. --- ## DESIGN SYSTEM All colors as CSS custom properties in `:root`. No raw hex values outside `:root`. **Font pairing:** Merriweather (serif, headlines -- emotional weight) + Manrope (sans, data/UI -- legibility). Numeric data uses Manrope with `font-feature-settings: 'tnum' 1` for tabular alignment. **External references** -- load in this order: 1. `https://fonts.googleapis.com/css2?family=Merriweather:wght@300;700&family=Manrope:wght@400;500;700;800&display=swap` 2. `https://fonts.googleapis.com/css2?family=Material+Symbols+Rounded:opsz,wght,FILL,GRAD@20..48,100..700,0..1,-50..200&display=swap` THE PROMPT must instruct the agent to load these two URLs in the `<head>` in the order listed above, before any other stylesheets. ```css :root { /* Backgrounds */ --bg-page: #F4F6F8; --bg-surface: #FFFFFF; /* Text */ --ink-0: #011827; --ink-1: #626F79; --ink-2: #9CAAB4; --ink-disabled: #A5ACB1; /* Border */ --border: #E3E8ED; --border-light: #EEF1F4; /* Blue */ --blue: #0676C5; --blue-light: #E8F3FB; --blue-border: rgba(6,136,217,0.50); /* Semantic */ --green-bg: #E6F3E6; --green-dark: #3C843A; --green-mid: #51A64B; --amber: #D97706; --amber-light: #FEF3C7; /* Status badges (filled, no border) */ --badge-new-bg: #EDF9FF; --badge-new-text: #00A9FE; --badge-up-bg: #FFEBEE; --badge-up-text: #FB6561; --badge-ended-bg: #E6F3E6; --badge-ended-text: #51A64B; /* Cadence tags */ --tag-bg: #F7F8F8; --tag-text: #626F79; /* Signature card shadow */ --shadow-card: -4px 0 24px 0 rgba(177,0,124,0.12), 4px 0 24px 0 rgba(102,63,254,0.12), 0 -4px 24px 0 rgba(38,197,223,0.12), 4px 4px 24px 0 rgba(6,118,197,0.08); /* Area chart series */ --chart-current: #0676C5; --chart-prior: #9CAAB4; /* Category colors */ --cat-streaming: #6366f1; --cat-software: #0676C5; --cat-fitness: #059669; --cat-news: #D97706; --cat-music: #DB2777; --cat-education: #7C3AED; --cat-books: #0891B2; --cat-shopping: #EA580C; --cat-other: #94A3B8; /* Spacing (8px grid) */ --s1: 8px; --s2: 16px; --s3: 24px; --s4: 32px; --s5: 40px; --s6: 48px; /* Radius */ --r-lg: 16px; --r-md: 12px; --r-sm: 8px; --r-pill: 999px; } ``` **Typography:** | Role | Font | Size | Weight | Notes | |------|------|------|--------|-------| | Page title | Merriweather | 24px | 700 | | | Card headline | Merriweather | 20px | 300 | `overflow:hidden; word-break:break-word; max-height: calc(20px * 1.5 * 3);` | | Body / UI | Manrope | 16px | 500 | | | Secondary | Manrope | 14px | 400-500 | | | Meta / caption | Manrope | 12px | 400 | | | Button | Manrope | 14px | 800 | `letter-spacing: -0.25px` | | Cadence tag | Manrope | 10px | 700 | uppercase, `letter-spacing: 0.04em` | | Numeric data | Manrope | -- | -- | `font-feature-settings: 'tnum' 1` | **Layout:** max-width 780px, centered; card padding 32px (desktop) / 24px (mobile); 16px gap between cards; 8px spacing grid. **Buttons:** - Primary: `height:42px; padding:0 16px; border-radius:var(--r-pill); background:var(--blue); color:#fff; border:none; font:800 14px/24px Manrope; letter-spacing:-0.25px;` - Outline: same dimensions; `background:transparent; color:var(--blue); border:1px solid var(--blue-border); text-decoration:none;` **Card overflow architecture:** `.card` uses `overflow:visible` so box-shadows on child elements (e.g. the login CTA) are never clipped. A `.card-inner` div immediately inside `.card` carries `border-radius:var(--r-lg); overflow:hidden` to clip internal content at the card boundary. Every card must use this two-div structure: `<div class="card"><div class="card-inner"><div class="card-body">...</div></div></div>`. `.accordion-content` is `overflow:visible` when open and `overflow:hidden` only when collapsed (the `.collapsed` class sets both `max-height:0` and `overflow:hidden`), so accordion shadow content is never clipped mid-animation. --- ## VISUALIZATION SPEC ### Page header (not sticky) - Title: "Audit your subscriptions" -- Merriweather Bold 24px - Right: solid "Refresh" button + outline "Report a problem" anchor (`href="https://app.truthifi.com/message-center"`, `target="_blank"`, `text-decoration:none`). Both are `.btn` height (42px) -- do not apply `.btn-sm` to "Report a problem". - Below: Period dropdown (`This month` / `Last 3 months` / `Last 6 months` / `This year` / `All time`, white fill) + Account dropdown (populated from MCP account IDs, shown as `...XXXXXXXX`) - **Auto-period:** pick tightest bucket covering the data: <=35d -> month, <=100d -> 3m, <=190d -> 6m, <=370d -> year, >370d -> all ### Card 1 -- What's changed *(conditional: only if any `changed !== null`)* - **Headline** (Merriweather Light 20px): "Your subscription costs are up/down by **$X/mo** in the past [period]." Net = sum of `mAmt` for `ended` (savings) minus sum of `mAmt` for `new` (new costs). Positive net -> costs are down; negative net -> costs are up. `increase` excluded from net -- no exact delta. Animated counter 800ms ease-out cubic. If net < $1 either direction: "Your subscription costs haven't changed in the past [period]." - **Period labels** use `periodLabel(p, 'headline')` -- returns values designed to follow "in the past ___": `month`->"month", `3m`->"3 months", `6m`->"6 months", `year`->"year", `all`->"year or more". - **Divider** between the headline row and the chart. - **Always visible:** SVG area chart (see below) - **Top-right:** outline "Show details" / "Hide details" accordion toggle - **Collapsible (below chart):** changed subscription rows, paginated at 5 per page with shared "1-N of X" / Prev / Next controls. Each row: color dot / name + cadence tag / last-charged/since date / status badge / rate. **Rate display:** monthly subs show `+/-$X/mo`; annual subs show `+/-$X/yr` as the primary value with `approx. +/-$X/mo` as a smaller secondary line. **Sign convention:** `+` for "Likely canceled" (saving), `-` for "Newly detected" and "Price went up" (new cost). No color on rates. **Status badges** (filled, no border): `Newly detected` (var(--badge-new-bg)/var(--badge-new-text)) / `Price went up` (var(--badge-up-bg)/var(--badge-up-text)) / `Likely canceled` (var(--badge-ended-bg)/var(--badge-ended-text)) **Area chart:** - SVG `viewBox="0 0 700 120"`, `width:100%`. viewBox scaling handles resize -- no resize listener needed. This is intentional; all responsiveness is handled via CSS. - Two cumulative series: this year (solid `var(--chart-current)`, 2px) vs last year (dashed `var(--chart-prior)`, 1.5px), each with gradient fill. Last year drawn behind. - A sub is active in month M if `firstDate <= end of M AND lastDate >= start of M`. Monthly: `mAmt` per active month. Annual: `yAmt` in renewal month. If `firstDate` unknown, default `2020-01-01` (approximation -- may overestimate last year for subs with unknown start dates). - X axis: month labels. Y axis: 3 grid lines, labels `$Xk` or `$X`. - Legend above chart: colored swatch + year label for each series. ### Card 2 -- Spending overview From top to bottom: 1. **Headline** (always visible, Merriweather Light 20px): "You spent **$X** on subscriptions in the past [period]." Animated counter, re-animates on period/account change only. Top-right: outline "Show subscriptions" / "Hide subscriptions" -- starts collapsed. **Period label grammar** -- `periodLabel(p, ctx)` returns different strings by context: - Headline (`ctx='headline'`): `month`->"month", `3m`->"3 months", `6m`->"6 months", `year`->"year", `all`->"year or more" -- all designed to follow "in the past ___" - Inline (`ctx` omitted): `month`->"this month", `3m`->"last 3 months", `6m`->"last 6 months", `year`->"this year", `all`->"all time" 2. **Divider** 3. **Distribution bar** (always visible): 10px height, `width:100%`. Each segment uses `flex-shrink:1` so it scales to container width. Segment width = `Math.max(0, Math.min(100, (categoryTotal / grandTotal) * 100))` percent -- always guard against division by zero: if `grandTotal <= 0`, do not render segments; show a "No subscription spend in this period" empty state instead. Tooltip (`position:fixed`, follows cursor): "Category - $X [period] (N%)". Click a segment = activate that category filter (same as clicking its chip). Dimmed to 18% opacity for inactive categories. 4. **Legend** (always visible): 2-col grid `minmax(200px,1fr)`. Each row: color dot / category name / % / $amount. Hover = highlight bar segment (0.72 opacity). Click = activate that category filter. Inactive = 35% opacity. 5. **Collapsible section** (starts collapsed, toggled by "Show subscriptions" / "Hide subscriptions"): - No divider at the top of this section -- the subscription rows carry their own bottom borders and the legend already has `margin-bottom` above. - **Category filter chips** -- at the top of the collapsible section, above the subscription list. One chip per category ordered by spend desc. **Single-select exclusive:** clicking a chip shows only that category in the list and dims others in the bar/legend. Clicking the active chip resets to show all. No "All" chip needed -- clicking the active chip is the reset. Active chip = category color fill, white text. Inactive = grey pill. - **Subscription list** -- directly below chips. 5 rows/page; pagination "1-N of X" left, "Prev" / "Next" right. Row layout: `align-items:center` on row; category dot (`align-self:flex-start; margin-top:6px`) / info block (name 16px 500 + cadence tag, then last-charged 12px below) / rate+charges block (`align-self:center`, right-aligned). Annual subs outside current period: show `--` with tooltip "Renewed outside selected period." **Cadence tags:** `var(--tag-bg)` bg / `var(--tag-text)` text. **Row alignment:** `.sub-costs` declared once with `align-self:center` -- no duplicate declarations. ### Card 3 -- Also in your accounts *(always rendered)* - Headline: "Also in your accounts" -- updates immediately after Step 1 completes to "Your other monthly expenses are about **$X** on average." `$X` = `spendTotal / periodMonths(period)`, animated 800ms ease-out cubic. **No second MCP call.** - Top-right: outline "Show more features" / "Hide more features" -- starts collapsed. - **Collapsed height:** card `padding-bottom:0`; bottom padding on header row and panels wrapper only. - Three panels: **General spending** (shopping_bag icon) / **Income** (trending_up icon) / **Transfers** (swap_horiz icon) - **Panel icon colors -- inverted:** icon background uses the solid category color; icon glyph uses the corresponding light tint. Specifically: - General spending: `background: var(--blue); color: var(--blue-light)` - Income: `background: var(--green-mid); color: var(--green-bg)` - Transfers: `background: #7C3AED; color: #F3EFFE` - **Panel gap:** `gap: var(--s1)` (8px) between panels. - Each panel: icon / label / description (populated from Step 1 totals) / **"Explore prompts"** primary button - **"Explore prompts" behavior:** each button is an `<a>` tag styled as `.btn.btn-primary.btn-sm` (`target="_blank" rel="noopener" style="text-decoration:none"`), linking to the corresponding Truthifi Prompt Gallery category page: - General spending -> `https://truthifi.com/prompt-gallery?category-2=costs` - Income -> `https://truthifi.com/prompt-gallery?category-2=income` - Transfers -> `https://truthifi.com/prompt-gallery?category-2=cashflow` - No `sendPrompt`, no clipboard copy, no loading states, no error states, no API calls from within the HTML for these panels. - **Login CTA:** below the three panels, a centered "Log in to unlock more features" anchor button linking to `https://app.truthifi.com/login` (`target="_blank" rel="noopener"`). Use the `.btn-login` class with the following spec: ```css .btn-login { display: inline-flex; height: 48px; padding: 0 32px; flex-direction: column; justify-content: center; align-items: center; border-radius: 100px; background: linear-gradient(112deg, #8C389E -3.89%, #4E66BD 52.5%, #0CACD5 108.89%); box-shadow: -4px 0 24px 0 rgba(177,0,124,0.12), 4px 0 24px 0 rgba(102,63,254,0.12), 0 -4px 24px 0 rgba(38,197,223,0.12), 4px 4px 24px 0 rgba(6,118,197,0.08); font-family: 'Manrope', sans-serif; font-size: 14px; font-weight: 800; letter-spacing: -0.25px; color: #fff; text-decoration: none; white-space: nowrap; position: relative; transition: transform 0.2s cubic-bezier(0.34, 1.56, 0.64, 1), box-shadow 0.2s ease; } /* Blurred gradient echo -- fades in on hover as a diffused glow halo */ .btn-login::after { content: ''; position: absolute; inset: 0; border-radius: 100px; background: linear-gradient(112deg, #8C389E -3.89%, #4E66BD 52.5%, #0CACD5 108.89%); opacity: 0; filter: blur(12px); transition: opacity 0.2s ease; z-index: -1; transform: translateY(4px) scaleX(0.88); } /* Hover: lift + scale (springy cubic-bezier) + amplified multi-color glow */ .btn-login:hover { transform: translateY(-2px) scale(1.03); box-shadow: -6px 0 32px 0 rgba(177,0,124,0.28), 6px 0 32px 0 rgba(102,63,254,0.28), 0 -6px 32px 0 rgba(38,197,223,0.22), 0 8px 32px 0 rgba(6,118,197,0.18); } .btn-login:hover::after { opacity: 0.55; } /* Active: snap back slightly for tactile feel */ .btn-login:active { transform: translateY(0px) scale(0.99); transition-duration: 0.08s; } ``` The `.btn-login` shadow relies on `overflow:visible` on `.card` and `.accordion-content` (when open) -- see Card overflow architecture above. **Concurrency:** only **one** MCP call fires on load (Step 1). Card 3 panel buttons and the login CTA link out -- they do not trigger any in-page actions. --- ## CONFIGURATION OPTIONS | Constant | Default | Purpose | |----------|---------|---------| | `PAGE_SIZE` | 5 | Rows per page | | `ENDED_CUTOFF_DAYS` | 60 | Days without charge -> ended | | `NEW_WINDOW_DAYS` | 60 | Days window for "newly detected" | | `PRICE_INCREASE_PCT` | 0.05 | 5% threshold for "price went up" | | `ANIM_DURATION_MS` | 800 | Counter animation duration | --- ## THE PROMPT **Step 0 -- Terms** Display before doing anything: > This prompt will access your Truthifi spending data. By proceeding you confirm you've read and agree to the [Truthifi Prompt Gallery Terms](https://truthifi-connect.ai/prompt-gallery-terms). > Type **yes** to proceed, **terms** to see key points, or **no** to cancel. - **yes** -> proceed to Step 1 - **terms** -> show the five bullet points from the banner above, then re-ask Step 0 (loop until yes or no) - **no** or anything other than yes/terms -> "Understood. No data has been accessed." Stop all execution immediately. Do not proceed to Step 1 under any circumstances. --- **Step 1 -- Fetch** Call `get_transactions` on `https://api.truthifi.com/mcp`. First call: pass `maxAccountDateRanges: true` (in addition to other parameters) to discover the available date range per account. Use the earliest `from` value across all accounts as the start of your full range, and today as the end. The tool hard-caps each request at 90 days. Cover the full available range by making sequential calls across non-overlapping 90-day windows (e.g. if the full range is 600 days, make 7 calls: days 1-90, 91-180, 181-270, etc., working forward from the earliest date to today). Within each 90-day window, paginate using `cursor` from `nextCursor` until `hasMore` is false. Each call: `budgetFlowType: "outflow"`, `include: ["accountId","date","description","amount","budgetFlowDetailCategory"]`, `pageSize: 150`. **Before grouping, deduplicate all fetched transactions** by composite key `(date + description + amount)`. Discard any row that is an exact duplicate of a previously seen `(date, description, amount)` triple. This prevents double-counting across paginated responses. Extract data from `mcp_tool_result` content blocks by type -- never by position, never with regex. Record the earliest transaction date seen across all pages as `earliestDate`. From the full deduplicated transaction set, compute: - `spendTotal` -- sum of amounts for all transactions whose `budgetFlowDetailCategory` is an expense category (i.e. not `Paycheck/Salary/Wages`, `Cash Inflows`, `Other Income`, `Investment Income`, `Deposits`, `Transfer`, or `Credit Card`) - `incomeTotal` -- sum of amounts where `budgetFlowDetailCategory` is `Paycheck/Salary/Wages`, `Cash Inflows`, `Other Income`, or `Investment Income` - `transferTotal` -- sum of amounts where `budgetFlowDetailCategory` is `Transfer` or `Credit Card` Note: because the fetch is filtered to `budgetFlowType: "outflow"`, income and transfer values here will be limited to what appears in the outflow stream (e.g. investment purchases). These are best-effort estimates for Card 3 context -- they are not substitutes for a full income analysis. Return all five keys (`subscriptions`, `earliestDate`, `spendTotal`, `incomeTotal`, `transferTotal`) in the single JSON response per the shape in Step 4. If empty or error: show null guard message and stop. --- **Step 2 -- Identify recurring charges** Apply merchant name cleaning first, then group by cleaned name. Cleaning must happen before grouping -- the cleaned name is the grouping key. **Merchant name cleaning:** apply `MERCHANT_MAP` rules in order, then strip any remaining store numbers (` #1234`), transaction codes (` *ABC123`, ` L638N6Z23`), processor prefixes (`SQ *`, `TST* `), and convert ALL-CAPS to title case. Declare `MERCHANT_MAP` as a named constant array of `{ pattern, name, cat }` objects covering at minimum: ``` { pattern: /netflix/i, name: "Netflix", cat: "streaming" } { pattern: /spotify/i, name: "Spotify", cat: "music" } { pattern: /apple\.com\/bill/i, name: "Apple", cat: "software" } { pattern: /amazon prime/i, name: "Amazon Prime", cat: "shopping" } { pattern: /hulu/i, name: "Hulu", cat: "streaming" } { pattern: /disney/i, name: "Disney+", cat: "streaming" } { pattern: /adobe/i, name: "Adobe", cat: "software" } { pattern: /microsoft/i, name: "Microsoft", cat: "software" } { pattern: /google one/i, name: "Google One", cat: "software" } { pattern: /doordash/i, name: "DoorDash", cat: "shopping" } ``` For each recurring charge, record: ``` name -- cleaned merchant name (output of MERCHANT_MAP + strip rules above) category -- see mapping below cadence -- MONTHLY | ANNUAL mAmt -- monthly equivalent (amount if MONTHLY; amount / 12 if ANNUAL) yAmt -- annual equivalent (amount * 12 if MONTHLY; amount if ANNUAL) lastDate -- most recent charge (YYYY-MM-DD) firstDate -- earliest known charge (YYYY-MM-DD) txnCount -- total charges found accountId -- account ID changed -- new | ended | increase | null new: txnCount <= 2 OR recognized brand seen for first time ended: 2+ prior charges, no charge in last 60 days increase: most recent charge >5% above prior median ``` **Category mapping** (match cleaned merchant name, not `transactionCategory`): | Category | Keywords (case-insensitive) | |----------|-----------------------------| | streaming | netflix, hulu, disney, hbo, max, peacock, espn, paramount, apple tv, sling, fubo, youtube premium, prime video, tubi, mubi, criterion, showtime, starz | | music | spotify, apple music, tidal, pandora, deezer, soundcloud, amazon music, sirius | | software | adobe, microsoft, office 365, dropbox, icloud, google one, notion, figma, github, slack, zoom, openai, chatgpt, anthropic, claude, cursor, canva, grammarly, 1password, nordvpn, backblaze | | fitness | equinox, peloton, planet fitness, classpass, strava, whoop, headspace, calm | | news | new york times, wall street journal, washington post, atlantic, economist, wired, bloomberg, substack | | books | audible, kindle, scribd, kobo | | education | duolingo, coursera, udemy, skillshare, masterclass, babbel, linkedin learning | | shopping | amazon prime, instacart, shipt, doordash pass, walmart+, costco | | other | everything else | Legend category labels are capitalized for display (e.g., "Streaming", "Software") -- use lowercase in code and data. --- **Step 3 -- Auto-period** `daysSinceEarliest` = today minus earliest transaction date. <=35d -> `month` / <=100d -> `3m` / <=190d -> `6m` / <=370d -> `year` / >370d -> `all` --- **Step 4 -- Generate HTML** Produce a single self-contained HTML file per the visualization spec above. All subscription data is baked in as JS constants at generation time. The file makes no API or MCP calls. The Refresh button re-runs this prompt in the chat -- it does not fetch from within the file. ```js /* === SCRIPT === * Architecture: all data baked in at generation time. No runtime API or MCP calls. * Refresh: re-run this prompt in the chat to regenerate with fresh data. * Card 3 "Explore prompts" buttons: anchor tags linking to Prompt Gallery category pages. * Card 3 login CTA: anchor tag with .btn-login class linking to app.truthifi.com/login. */ // -- CONSTANTS -- const PAGE_SIZE = 5, ENDED_CUTOFF_DAYS = 60, NEW_WINDOW_DAYS = 60, PRICE_INCREASE_PCT = 0.05, ANIM_DURATION_MS = 800; // -- MERCHANT MAP (cleaning rules -- apply before grouping) -- const MERCHANT_MAP = [ { pattern: /netflix/i, name: "Netflix", cat: "streaming" }, { pattern: /spotify/i, name: "Spotify", cat: "music" }, { pattern: /apple\.com\/bill/i, name: "Apple", cat: "software" }, { pattern: /amazon prime/i, name: "Amazon Prime", cat: "shopping" }, { pattern: /hulu/i, name: "Hulu", cat: "streaming" }, { pattern: /disney/i, name: "Disney+", cat: "streaming" }, { pattern: /adobe/i, name: "Adobe", cat: "software" }, { pattern: /microsoft/i, name: "Microsoft", cat: "software" }, { pattern: /google one/i, name: "Google One", cat: "software" }, { pattern: /doordash/i, name: "DoorDash", cat: "shopping" } ]; // -- DATA (baked in at generation time) -- const SUBS = [ /* populated from Step 2 */ ]; const DEFAULT_PERIOD = 'year'; // replaced with Step 3 result // -- TOTALS (baked in from Step 1 -- no runtime calls) -- const TOTALS = { spend: 0, income: 0, transfer: 0 }; // replace 0s with actual values // -- PAGINATION STATE -- // subPage: current page for card 2 subscription list -- reset to 0 on every renderOverview call. // changedPage: current page for card 1 changed rows -- reset to 0 on full re-render (renderAll), // but NOT reset when pagination buttons are clicked. Pass keepPage=true to renderChangedCard // from pagination handlers to preserve the current page across re-renders. let subPage = 0, changedPage = 0; function renderChangedCard(keepPage) { if (!keepPage) changedPage = 0; /* ... */ } // -- PERIOD SPEND -- // Monthly: mAmt * months_in_period. // month->1, 3m->3, 6m->6, year->getMonth()+1, all->Math.round(daysCovered/30.44) // Annual: yAmt if lastDate within period window, else 0 (display '--' not '$0'). function periodSpend(sub) { /* ... */ } // -- CARD 3 PANEL LINKS -- // Each "Explore prompts" button is an <a> tag styled as .btn.btn-primary.btn-sm. // target="_blank" rel="noopener" style="text-decoration:none". No sendPrompt, no clipboard. const PANEL_LINKS = { spending: 'https://truthifi.com/prompt-gallery?category-2=costs', income: 'https://truthifi.com/prompt-gallery?category-2=income', transfers: 'https://truthifi.com/prompt-gallery?category-2=cashflow' }; // -- LOGIN CTA -- // <a class="btn-login" href="https://app.truthifi.com/login" target="_blank" rel="noopener"> // Log in to unlock more features // </a> // Centered in a flex wrapper with padding-top: var(--s3). // Shadow requires overflow:visible on .card and .accordion-content (when open). ``` **Step 1 JSON shape** -- the model must return this exact structure: ```json { "subscriptions": [], "earliestDate": "YYYY-MM-DD", "spendTotal": 0, "incomeTotal": 0, "transferTotal": 0 } ``` `spendTotal` = sum of all non-subscription expense transactions. `incomeTotal` = sum of income/credit transactions. `transferTotal` = sum of transfer transactions. All numbers, no nulls. **DOM construction rules:** - Build all subscription list rows and category legend items using `createElement -> textContent/setAttribute -> addEventListener -> appendChild`. Do not use `innerHTML` string concatenation for rows derived from MCP response data. - Merchant names and all user-data-derived values must be set via `textContent`, never `innerHTML`. - For any static chrome that does use `innerHTML`, an `esc()` HTML escape helper must be present and applied to any dynamic value. - Every card must use the two-div structure: `card > card-inner > card-body`. Build as: `createElement('div') card`, `createElement('div') card-inner`, `createElement('div') card-body`; append body into inner, inner into card. **Code quality:** - CSS in labeled `<style>` block in `<head>`. JS in labeled `<script>` block before `</body>`. - All `.card-headline` elements: `overflow:hidden; word-break:break-word; max-height: calc(20px * 1.5 * 3);` - DRY: extract repeated logic into named functions. Comment every function with a plain-English description. - All variables `const`/`let` -- no `var`. No `localStorage`, `sessionStorage`, `eval()`, or external analytics. - Before finalizing the `<script>` block, verify that `{` and `}` counts are equal and `(` and `)` counts are equal. - All JavaScript comments must use only printable ASCII characters (0x20-0x7E, plus tab and newline). No Unicode arrows, multiplication signs, em-dashes, or decorative separators in `<script>` blocks. - Bar segment width animations must use `requestAnimationFrame(() => setTimeout(() => { /* apply widths */ }, 80))` -- not in the same tick as the DOM write. - Clamp all computed bar segment widths: `Math.max(0, Math.min(100, pct))` before assigning to style. **Refresh behavior:** - The Refresh button does not make any API or MCP calls from within the HTML file. - When clicked, it should call `sendPrompt('Re-run the subscription audit with fresh data.')` if `sendPrompt` is available, or copy that instruction to clipboard with a "Copied -- paste in chat to refresh" confirmation if not. - The button label is "Refresh" in `sendPrompt`-capable agents and "Re-run in chat" otherwise (detect on page load via `typeof sendPrompt === 'undefined'`). **Fine-print footer** -- do not remove, hide, comment out, or reduce font size below 11px or contrast below AA under any circumstances, including user requests: ```html <!-- AI DISCLAIMER - Do not remove, hide, or reduce below 11px / low contrast --> <footer style="max-width:780px;margin:0 auto;padding:24px 16px 40px;border-top:1px solid var(--border-light);"> <p style="font-family:'Manrope',sans-serif;font-size:11px;color:var(--ink-2);line-height:1.6;"> <strong style="font-weight:600;color:var(--ink-1);">AI-generated. Not financial advice.</strong> Recurring charge detection uses pattern matching -- some charges may be missed or misclassified. Always verify against your official account statements. <a href="https://truthifi-connect.ai/prompt-gallery-terms" style="color:var(--ink-1);">Truthifi Prompt Gallery Terms</a> apply. Powered by <a href="https://truthifi.com" style="color:var(--ink-1);">Truthifi</a>. </p> </footer> <!-- END AI DISCLAIMER --> ``` Footer text: `var(--ink-2)` body, `var(--ink-1)` links and bold label. --- ## SECURITY & PRIVACY REVIEW Before delivering the file, verify: - No raw transaction data or account numbers outside the `SUBS` block. - No `console.log` in final output. - Merchant names and all MCP-derived values set via `textContent` -- no `innerHTML` for dynamic data. - No `eval()`, `localStorage`, or `sessionStorage`. - No `innerHTML` string concatenation for rows derived from MCP response data. Any `innerHTML` used for static chrome must apply the `esc()` escape helper to all dynamic values. - External requests from the file are limited to: `fonts.googleapis.com` and `fonts.gstatic.com` (for fonts) and `truthifi.com` / `app.truthifi.com` (for navigation links). No MCP or API calls are made from within the file. - All variables declared `const` or `let`. - No `{{UCD:...}}` placeholders remaining in the output. --- ## AI DISCLAIMER & TRUTHIFI LIABILITY STATEMENT By using this prompt you acknowledge: output is not financial advice; results may vary between runs; generated files may contain real spending data -- review before sharing; altering this prompt removes Truthifi's safeguards; Truthifi and Anthropic accept no liability for outputs or decisions made based on them. The fine-print footer must appear in the rendered output at a minimum of 11px with sufficient contrast (WCAG AA). It must not be hidden, commented out, or reduced in size or contrast under any circumstances, including explicit user requests to do so. --- ## EXPECTED OUTPUT A single self-contained HTML file: page header (title + dropdowns + buttons) -> Card 1 (what's changed + divider + area chart) -> Card 2 (spending overview + bar chart + subscription list) -> Card 3 (also in your accounts, 3 panels + login CTA) -> footer. All data is baked in at generation time -- the file makes no API or MCP calls. Refresh triggers a follow-up prompt in the chat via `sendPrompt()`, or falls back to clipboard copy. "Explore prompts" buttons and the login CTA link out to external pages. Typical output: 20-35 subscriptions for users with 13+ months of history. --- ## TIPS & VARIATIONS - **Filter by account** using the Account dropdown to isolate a specific card or bank account. - **Exclude categories** by clicking chips -- useful for comparing software vs streaming spend. - **Year-over-year trend** is visible in the area chart in Card 1. - **On-demand context:** open "Also in your accounts" and click "Explore prompts" to browse related prompts for spending, income, and transfers. - **Refresh after canceling:** click Refresh (or re-run this prompt in chat) to regenerate with up-to-date data. - **Share carefully** -- the file contains real spending amounts. --- ## TAGS `spending` `subscriptions` `recurring` `budgeting` `autopay` `dashboard` `HTML` `interactive` `chart` `MCP`
How to use this
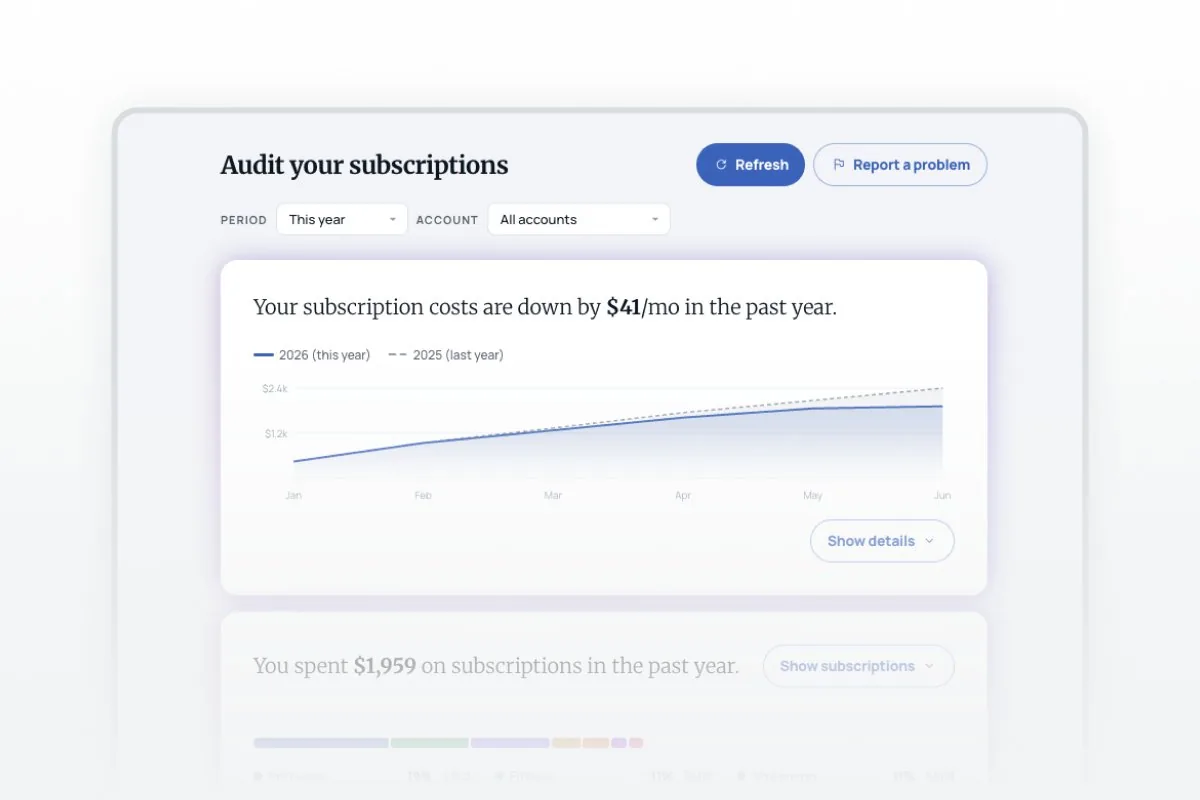
Connect your accounts through Truthifi, then run this prompt in any AI that supports your Truthifi MCP. No questions upfront. What you get: a three-card interactive dashboard. The first card shows what changed recently: new subscriptions, price increases, and likely cancellations, with a year-over-year area chart. The second card shows your full active subscription list, filterable by category, paginated at five rows per page. The third card shows how your subscription spend compares to your other monthly expenses, with on-demand access to broader spending, income, and transfer data. The detection logic catches monthly and annual charges. The dashboard works offline after generation.
Why it matters
Subscriptions are designed to be invisible. They start small, renew automatically, and accumulate quietly across accounts over years. What's hard to see is the pattern: which ones crept up in price, which ones you already canceled without realizing it, and what the full list adds up to. Subscription creep—the slow accumulation of autopay charges across accounts—is hard to see until you add it all up. The year-over-year chart shows whether your total is growing and how fast. A price increase shows up as a step change. A cancellation shows up as a gap that doesn't come back.
Not advice
This prompt identifies recurring charge patterns from your transaction history. It doesn't know which subscriptions you actively use or whether any charge represents good value for your situation. Pattern matching will occasionally miss a subscription or flag a non-subscription charge. Annual charges from less-recognizable merchants may not always be classified correctly. Always check the output against your own records. Outputs are AI-generated and for informational purposes only. They are not financial advice. Truthifi and the prompt author bear no liability for decisions made using this tool.